Funds dominated by metals, minerals and oil companies didn’t just lag broad indexes, they turned in an average annual loss of 7.3% for the past five years. Ouch.
To add insult to injury, the worst performers aren’t even cheap to buy. While expense ratios industrywide are largely caught in a race to the bottom, the average expense ratio on this list is more than 1% (17 out of 20 are over 50 basis points). By comparison, the S&P 500, as measured by the Vanguard 500 Index Fund (VOO), had a five-year return of 14.4% and an expense ratio of just 4 basis points.
To be sure, the pendulum can change abruptly, as some of the funds on this list have posted gains so far this year in the double digits. Others, though, have continued their losses.
Scroll through to see which funds with assets over $500 million have had the worst results the past five years. All data from Morningstar.

20. VanEck Global Hard Assets (GHAAX)
5-Yr. Returns: -3.97%
Expense Ratio: 1.38%
Total Assets (millions): $2,016

19. Fidelity Select Energy Service Port (FSESX)
5-Yr. Returns: -4.21%
Expense Ratio: 0.84%
Total Assets (millions): $518

18. Franklin Natural Resources (FRNRX)
5-Yr. Returns: -4.23%
Expense Ratio: 1.05%
Total Assets (millions): $528

17. Prudential Jennison Natural Resources (PRGNX)
5-Yr. Returns: -4.55%
Expense Ratio: 1.95%
Total Assets (millions): $1,537

16. Fidelity Latin America (FLATX)
5-Yr. Returns: -5.32%
Expense Ratio: 1.13%
Total Assets (millions): $611

15. Invesco Energy Inv (FSTEX)
5-Yr. Returns: -5.32%
Expense Ratio: 1.27%
Total Assets (millions): $652

14. Victory Global Natural Resources (RSNRX)
5-Yr. Returns: -5.41%
Expense Ratio: 1.48%
Total Assets (millions): $1,489

13. JHancock Natural Resources (JHNRX)
5-Yr. Returns: -5.44%
Expense Ratio: 0.95%
Total Assets (millions): $518

12. Vanguard Precious Metals and Mining (VGPMX)
5-Yr. Returns: -5.63%
Expense Ratio: 0.43%
Total Assets (millions): $2,592

11. VanEck Vectors Oil Services ETF (OIH)
5-Yr. Returns: -7.10%
Expense Ratio: 0.35%
Total Assets (millions): $1,045

10. SPDR S&P Oil & Gas Explor & Prodtn ETF (XOP)
5-Yr. Returns: -7.63%
Expense Ratio: 0.35%
Total Assets (millions): $2,010

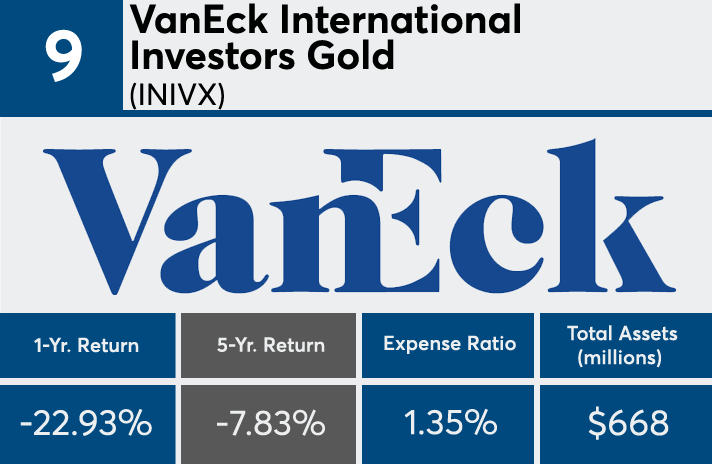
9. VanEck International Investors Gold (INIVX)
5-Yr. Returns: -7.83%
Expense Ratio: 1.35%
Total Assets (millions): $668

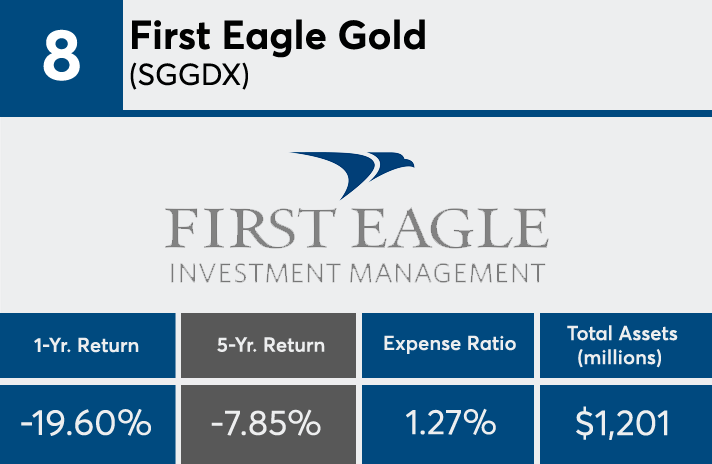
8. First Eagle Gold (SGGDX)
5-Yr. Returns: -7.85%
Expense Ratio: 1.27%
Total Assets (millions): $1,201

7. Franklin Gold and Precious Metals (FKRCX)
5-Yr. Returns: -8.828%
Expense Ratio: 1.11%
Total Assets (millions): $1,099

6. Tocqueville Gold (TGLDX)
5-Yr. Returns: -8.830%
Expense Ratio: 1.39%
Total Assets (millions): $1,178

5. Oppenheimer Gold & Special Minerals (OPGSX)
5-Yr. Returns: -8.92%
Expense Ratio: 1.17%
Total Assets (millions): $1,044

4. Fidelity Select Gold (FSAGX)
5-Yr. Returns: -9.25%
Expense Ratio: 0.84%
Total Assets (millions): $1,460

3. VanEck Vectors Gold Miners ETF (GDX)
5-Yr. Returns: -11.15%
Expense Ratio: 0.51%
Total Assets (millions): $7,270

2. USAA Precious Metals and Minerals (USAGX)
5-Yr. Returns: -11.21%
Expense Ratio: 1.22%
Total Assets (millions): $585

1. VanEck Vectors Junior Gold Miners ETF (GDXJ)
5-Yr. Returns: -13.51%
Expense Ratio: 0.52%
Total Assets (millions): $3,817


