
Indeed, against that bullish backdrop, the worst-performing funds over the past 10 years were mostly found in the natural resources sector, including mining and gold.
In fact, for some of funds in this sector, the financial crisis wasn’t even the low point. Some on this list had bigger annual losses in 2013, a particularly bad year for gold and other precious metals, as well as agricultural products.
Commodities, and sectors related to them, are highly cyclical, explains Greg McBride, chief financial analyst at financial website Bankrate. “The performance over the past 10 years has been lackluster because it came on the heels of a commodity boom in the years preceding the great recession,” he says. Slower economic growth was a global theme over much of the last decade, not just a U.S. theme, he adds.
Overall, the 20 worst-performing funds posted an average annualized loss of 3.8% over 10 years. Adding insult to injury, expense ratios were relatively high. The average on this list was 1.19% — with the highest edging above 2%.
Scroll through to see the worst-performing mutual funds over the past 10 years. We also show each fund’s one-year return, expense ratios and total assets. Highly leveraged funds, those with less than $500 million in assets, funds with investment minimums of more than $100,000 and institutional funds were excluded. All data from Morningstar Direct.

20. T. Rowe Price Latin America (PRLAX)
10-Yr. Return: -0.98%
Expense Ratio: 1.38%
Total Assets (millions): $759.18

19. Janus Henderson Overseas D (JNOSX)
10-Yr. Return: -1.15%
Expense Ratio: 0.62%
Total Assets (millions): $1,812.20

18. Fidelity Select Energy (FSENX)
10-Yr. Return: -1.21%
Expense Ratio: 0.79%
Total Assets (millions): $2001.94

17. Fidelity Select Natural Resources Port (FNARX)
10-Yr. Return: -1.52%
Expense Ratio: 0.84%
Total Assets (millions): $1,022.54

16. Fidelity Advisor Energy M (FAGNX)
10-Yr. Return: -1.69%
Expense Ratio: 1.36%
Total Assets (millions): $949.47

15. VanEck Global Hard Assets A (GHAAX)
10-Yr. Return: -2.83%
Expense Ratio: 1.38%
Total Assets (millions): $2,155.49
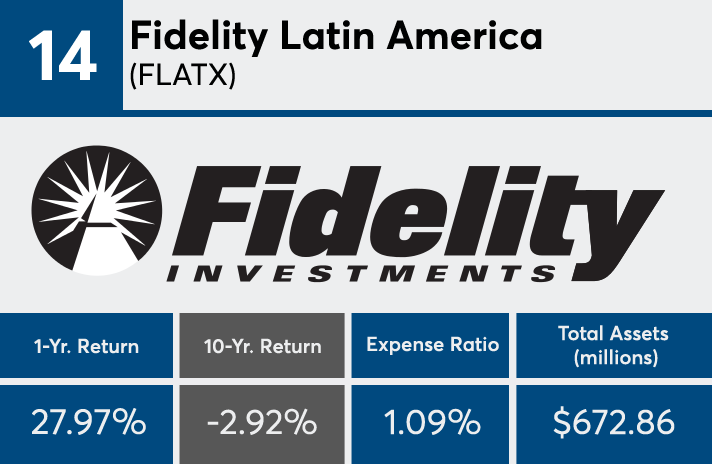
14. Fidelity Latin America (FLATX)
10-Yr. Return: -2.92%
Expense Ratio: 1.09%
Total Assets (millions): $672.86

13. Franklin Natural Resources A (FRNRX)
10-Yr. Return: -2.99%
Expense Ratio: 1.06%
Total Assets (millions): $552.18

12. Tocqueville Gold (TGLDX)
10-Yr. Return: -3.22%
Expense Ratio: 1.40%
Total Assets (millions): $1,058.11
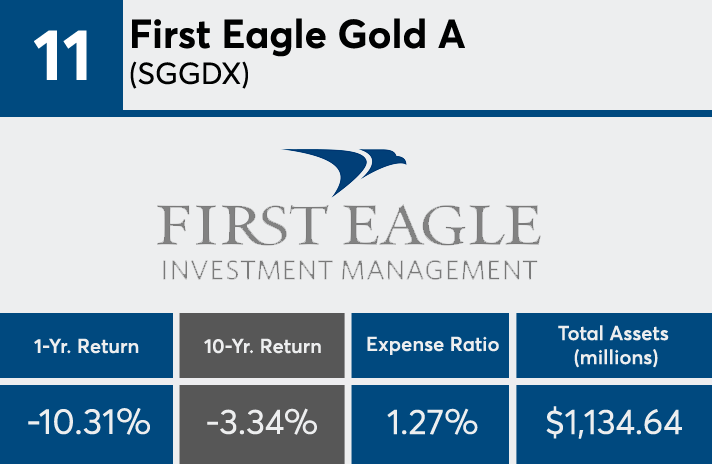
11. First Eagle Gold A (SGGDX)
10-Yr. Return: -3.34%
Expense Ratio: 1.27%
Total Assets (millions): $1,134.64

10. Invesco Energy Inv (FSTEX)
10-Yr. Return: -3.77%
Expense Ratio: 1.27%
Total Assets (millions): $587.42
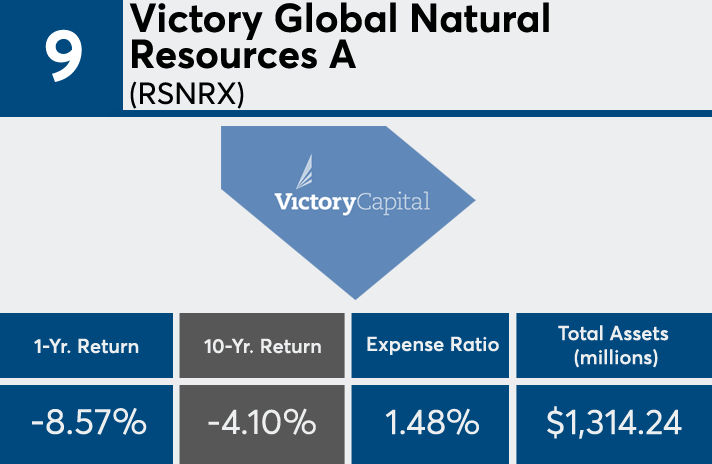
9. Victory Global Natural Resources A (RSNRX)
10-Yr. Return: -4.10%
Expense Ratio: 1.48%
Total Assets (millions): $1,314.24

8. VanEck International Investors Gold A (INIVX)
10-Yr. Return: -4.16%
Expense Ratio: 1.35%
Total Assets (millions): $673.92
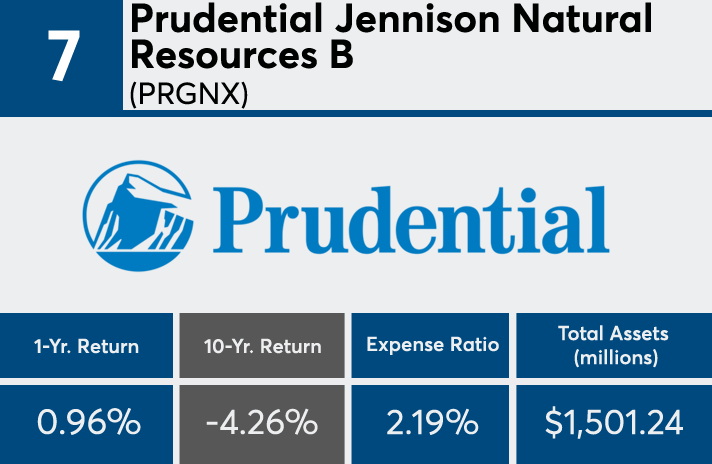
7. Prudential Jennison Natural Resources B (PRGNX)
10-Yr. Return: -4.26%
Expense Ratio: 2.19%
Total Assets (millions): $1,501.24

6. Ivy Natural Resources A (IGNAX)
10-Yr. Return: -5.30%
Expense Ratio: 1.62%
Total Assets (millions): $599.75

5. Oppenheimer Gold & Special Minerals A (OPGSX)
10-Yr. Return: -5.39%
Expense Ratio: 1.17%
Total Assets (millions): $1,003.32

4. USAA Precious Metals and Minerals (USAGX)
10-Yr. Return: -6.08%
Expense Ratio: 1.22%
Total Assets (millions): $556.23

3. Fidelity Select Gold (FSAGX)
10-Yr. Return: -6.20%
Expense Ratio: 0.84%
Total Assets (millions): $1,393.69

2. Franklin Gold and Precious Metals A (FKRCX)
10-Yr. Return: -6.39%
Expense Ratio: 0.98%
Total Assets (millions): $988.06
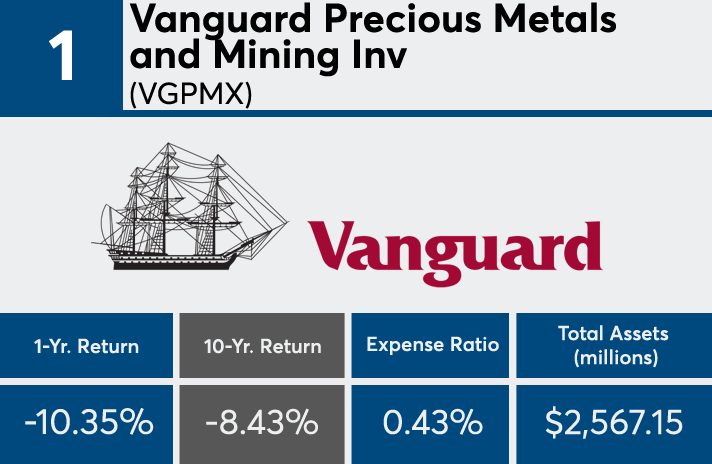
1. Vanguard Precious Metals and Mining Inv (VGPMX)
10-Yr. Return: -8.43%
Expense Ratio: 0.43%
Total Assets (millions): $2,567.15


