Scroll through to see the 20 mutual funds that underperformed their benchmarks the most for the past three years, on an annualized basis. All data from Morningstar as of June 28.
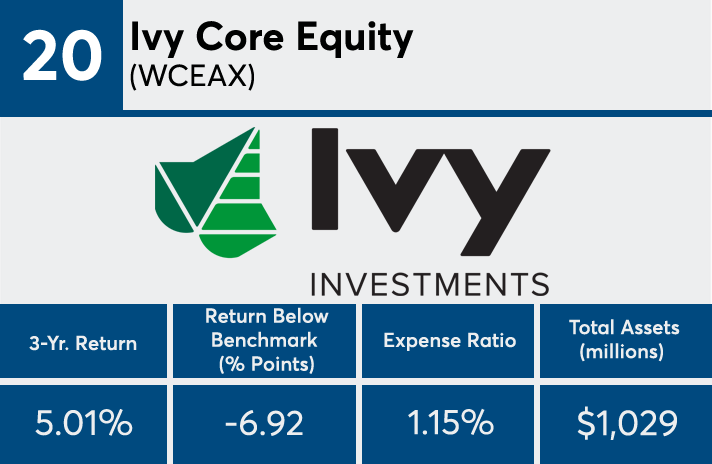
20. Ivy Core Equity (WCEAX)
Return Below Benchmark (% points): -6.92
Expense Ratio: 1.15%
Total Assets (millions): $1,029

19. Putnam Equity Spectrum (PYSAX)
Return Below Benchmark (% points): -6.993
Expense Ratio: 1.04%
Fund Assets (millions): $1,274

18. Janus Henderson Contrarian (JCNAX)
Return Below Benchmark (% points): -6.994
Expense Ratio: 0.90%
Fund Assets (millions): $2,813

17. ClearBridge Aggressive Growth (SHRAX)
Return Below Benchmark (% points): -7.01
Expense Ratio: 1.14%
Fund Assets (millions): $11,812
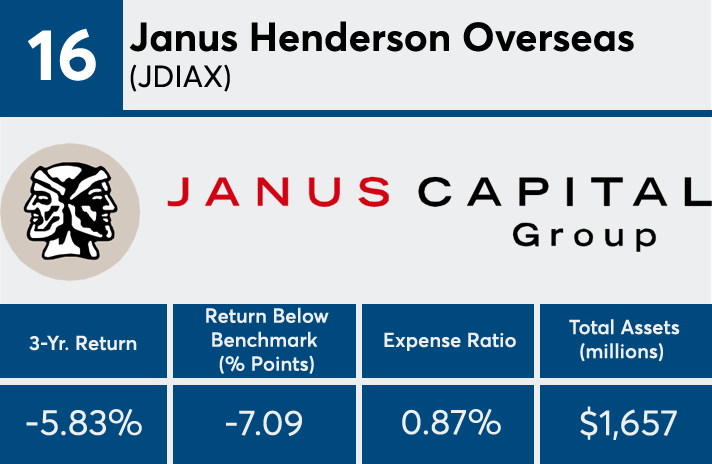
16. Janus Henderson Overseas (JDIAX)
Return Below Benchmark (% points): -7.09
Expense Ratio: 0.87%
Fund Assets (millions): $1,657

15. JHancock Technical Opportunities (JTCAX)
Return Below Benchmark (% points): -7.16
Expense Ratio: 1.65%
Fund Assets (millions): $626

14. Pimco EqS Long/Short (PMHAX)
Return Below Benchmark (% points): -7.46
Expense Ratio: 1.85%
Fund Assets (millions): $548
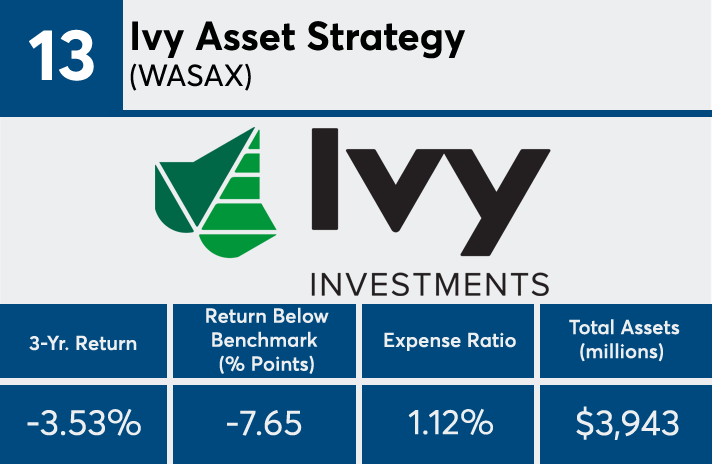
13. Ivy Asset Strategy (WASAX)
Return Below Benchmark (% points): -7.65
Expense Ratio: 1.12%
Fund Assets (millions): $3,943

12. ClearBridge Tactical Dividend Income (CFLGX)
Return Below Benchmark (% points): -7.74
Expense Ratio: 1.17%
Fund Assets (millions): $592

11. Goldman Sachs Rising Dividend Gr (GSRAX)
Return Below Benchmark (% points): -7.82
Expense Ratio: 1.14%
Fund Assets (millions): $2,100

10. Neuberger Berman Long Short (NLSAX)
Return Below Benchmark (% points): -7.86
Expense Ratio: 1.69%
Fund Assets (millions): $2,791
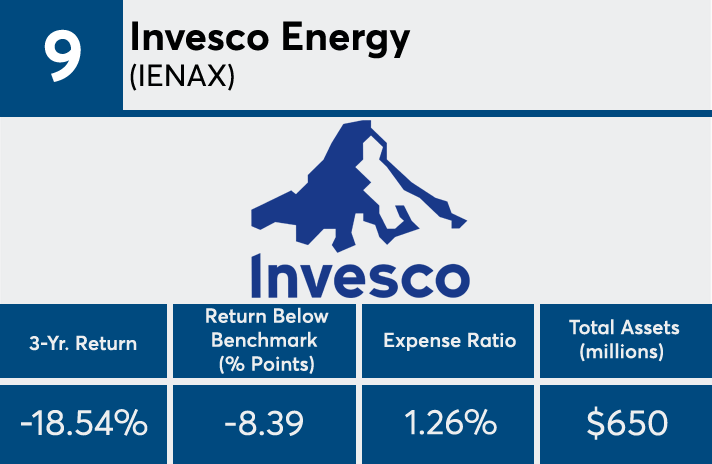
9. Invesco Energy (IENAX)
Return Below Benchmark (% points): -8.39
Expense Ratio: 1.26%
Fund Assets (millions): $650

8. Catalyst Hedged Futures Strategy (HFXAX)
Return Below Benchmark (% points): -9.02
Expense Ratio: 2.17%
Fund Assets (millions): $2,436

7. MFS Utilities (MMUFX)
Return Below Benchmark (% points): -10.35
Expense Ratio: 0.99%
Fund Assets (millions): $4,033
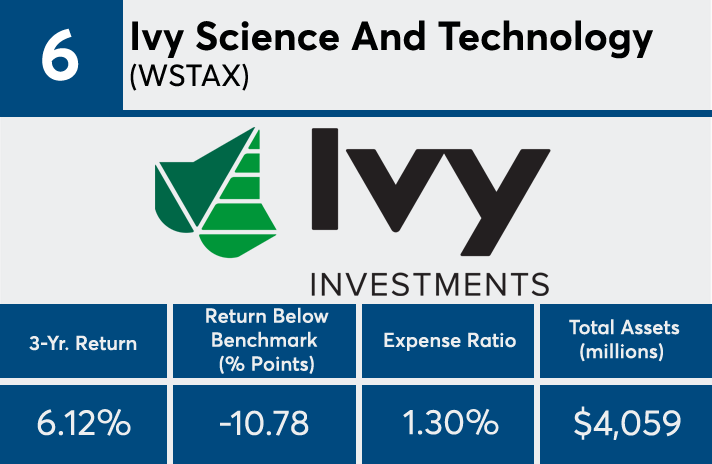
6. Ivy Science And Technology (WSTAX)
Return Below Benchmark (% points): -10.78
Expense Ratio: 1.30%
Fund Assets (millions): $4,059

5. Virtus Equity Trend (VAPAX)
Return Below Benchmark (% points): -11.31
Expense Ratio: 1.50%
Fund Assets (millions): $592

4. Waddell & Reed Science & Tech (UNSCX)
Return Below Benchmark (% points): -11.37
Expense Ratio: 1.27%
Fund Assets (millions): $3,531

3. AB All Market Real Return (AMTAX)
Return Below Benchmark (% points): -12.91
Expense Ratio: 1.30%
Fund Assets (millions): $1,423
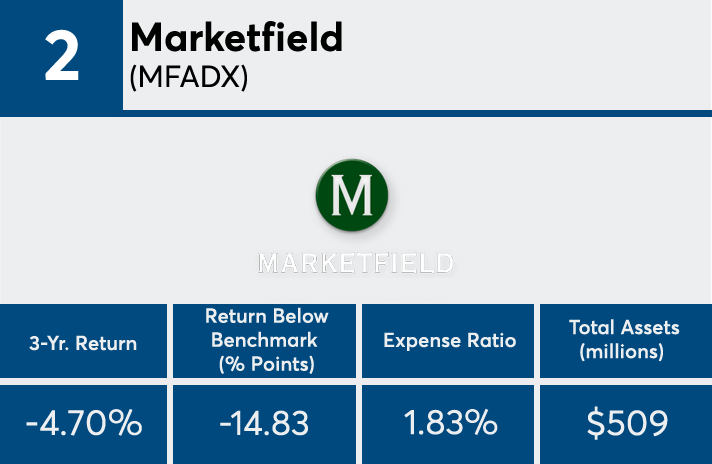
2. Marketfield (MFADX)
Return Below Benchmark (% points): -14.83
Expense Ratio: 1.83%
Fund Assets (millions): $509

1. Pimco StocksPlus Short (PSSAX)
Return Below Benchmark (% points): -19.38
Expense Ratio: 1.04%
Fund Assets (millions): $2,284


