Vanguard’s record rake was an extreme example of the general trend last year of a rush for more passive investments. Indeed, the top three fund families, rounded out by BlackRock and State Street, also focus on ETFs.
BlackRock, a distant second, drew $99 billion in 2016. Often listed as the largest asset manager in the world, BlackRock is listed here as having just $1.4 trillion in assets given our parameters.
To be sure, other well-known names in this space aren’t listed here at all since this is ranked on one-year flow data and not total AUM. For instance, T. Rowe Price had an outflow of $4.5 billion in 2016, according to Morningstar’s data. PIMCO had an outflow of $15 billion; Fidelity had an outflow of $23 billion; and Franklin Templeton had the biggest annual outflow of $42 billion.
Scroll through to see the biggest inflows of 2016.

20. Harding Loevner
3-Yr, estimated net flows (millions): $6,371
5-Yr,estimated net flows (millions): $9,773
Total net assets (millions): $14,529

19. Flexshares Trust
3-Yr, estimated net flows (millions): $5,219
5-Yr,estimated net flows (millions): $11,391
Total net assets (millions): $11,721

18. ProShares
3-Yr, estimated net flows (millions): $6,620
5-Yr,estimated net flows (millions): $12,899
Total net assets (millions): $26,244

17. Parnassus
3-Yr, estimated net flows (millions): $6,757
5-Yr,estimated net flows (millions): $8,332
Total net assets (millions): $20,437

16. Lord Abbett
3-Yr, estimated net flows (millions): -$2,227
5-Yr,estimated net flows (millions): $15,911
Total net assets (millions): $108,334

15. Prudential Investments
3-Yr, estimated net flows (millions): $10,356
5-Yr,estimated net flows (millions): $20,731
Total net assets (millions): $83,546

14. Guggenheim Investments
3-Yr, estimated net flows (millions): $18,669
5-Yr,estimated net flows (millions): $24,436
Total net assets (millions): $46,431

13. PowerShares
3-Yr, estimated net flows (millions): $1,830
5-Yr,estimated net flows (millions): $23,690
Total net assets (millions): $103,998

12. Metropolitan West Funds
3-Yr, estimated net flows (millions): $51,490
5-Yr,estimated net flows (millions): $59,634
Total net assets (millions): $86,694

11. Van Eck
3-Yr, estimated net flows (millions): $11,436
5-Yr,estimated net flows (millions): $17,550
Total net assets (millions): $34,156

10. DoubleLine
3-Yr, estimated net flows (millions): $31,973
5-Yr,estimated net flows (millions): $48,087
Total net assets (millions): $71,897

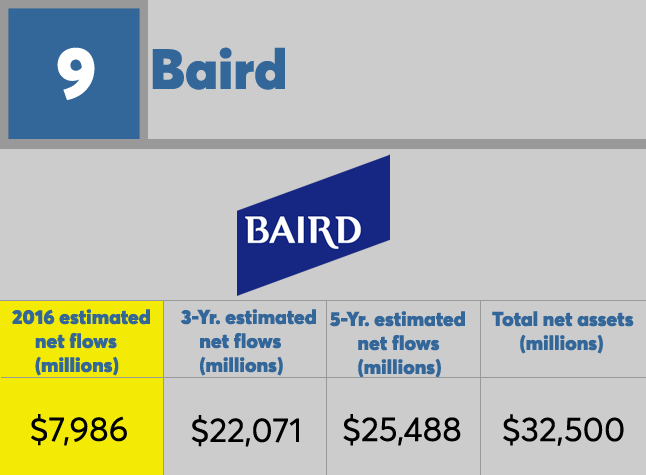
9. Baird
3-Yr, estimated net flows (millions): $22,071
5-Yr,estimated net flows (millions): $25,488
Total net assets (millions): $32,500

8. TIAA-CREF Asset Management
3-Yr, estimated net flows (millions): $22,505
5-Yr,estimated net flows (millions): $37,202
Total net assets (millions): $103,862

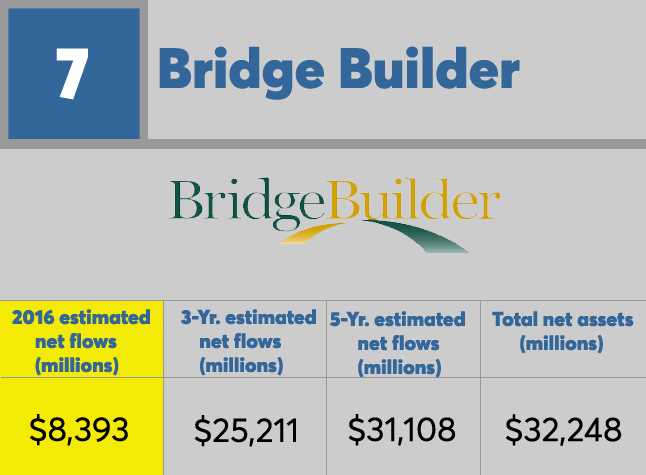
7. Bridge Builder
3-Yr, estimated net flows (millions): $25,211
5-Yr,estimated net flows (millions): $31,108
Total net assets (millions): $32,248

6. AQR Funds
3-Yr, estimated net flows (millions): $18,369
5-Yr,estimated net flows (millions): $25,832
Total net assets (millions): $32,534

5. Schwab ETFs
3-Yr, estimated net flows (millions): $39,079
5-Yr,estimated net flows (millions): $48,090
Total net assets (millions): $59,750

4. Dimensional Fund Advisors
3-Yr, estimated net flows (millions): $73,850
5-Yr,estimated net flows (millions): $111,774
Total net assets (millions): $316,073

3. SPDR State Street Global Advisors
3-Yr, estimated net flows (millions): $65,231
5-Yr,estimated net flows (millions): $117,289
Total net assets (millions): $501,890

2. BlackRock/iShares
3-Yr, estimated net flows (millions): $307,299
5-Yr,estimated net flows (millions): $424,568
Total net assets (millions): $1,203,390

1. Vanguard
3-Yr, estimated net flows (millions): $726,473
5-Yr,estimated net flows (millions): $997,101
Total net assets (millions): $3,404,657


