
On the other hand, a return of 3% can have value for clients who want to be diversified, if the benchmark posted a loss.
Scroll through to see the 20 best mutual funds for the past three years, on an annualized basis, compared against their respective benchmarks.
All data from Morningstar as of June 23.

20. RMB Mendon Financial Services (RMBKX)
Return Over Benchmark (% points): 7.37
Expense Ratio: 1.40%
Fund Assets (millions): $557

19. DoubleLine Shiller Enhanced CAPE (DSENX)
Return Over Benchmark (% points): 7.42
Expense Ratio: 0.85%
Fund Assets (millions): $4,052
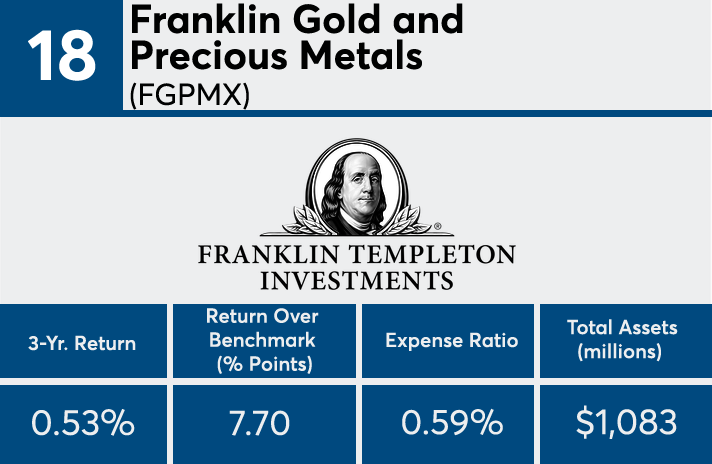
18. Franklin Gold and Precious Metals (FGPMX)
Return Over Benchmark (% points): 7.70
Expense Ratio: 0.59%
Fund Assets (millions): $1,083
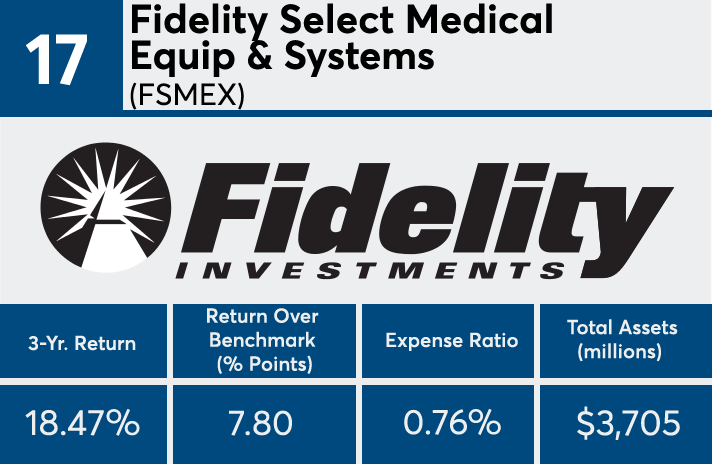
17. Fidelity Select Medical Equip & Systems (FSMEX)
Return Over Benchmark (% points): 7.80
Expense Ratio: 0.76%
Fund Assets (millions): $3,705

16. Oppenheimer Gold & Special Minerals (OPGSX)
Return Over Benchmark (% points): 8.29
Expense Ratio: 1.17%
Fund Assets (millions): $1,085

15. Invesco Balanced-Risk Commodity Strat (IBRFX)
Return Over Benchmark (% points): 8.62
Expense Ratio: 1.13%
Fund Assets (millions): $765

14. T. Rowe Price Real Assets (PRAFX)
Return Over Benchmark (% points): 8.77
Expense Ratio: 0.84%
Fund Assets (millions): $3,353

13. VanEck International Investors Gold (INIVX)
Return Over Benchmark (% points): 8.880
Expense Ratio: 1.35%
Fund Assets (millions): $682

12. Matthews India Investor (MINDX)
Return Over Benchmark (% points): 8.884
Expense Ratio: 1.12%
Fund Assets (millions): $2,157

11. Fidelity Select Gold (FSAGX)
Return Over Benchmark (% points): 9.26
Expense Ratio: 0.84%
Fund Assets (millions): $1,468

10. First Eagle Gold (SGGDX)
Return Over Benchmark (% points): 9.41
Expense Ratio: 1.27%
Fund Assets (millions): $1,222

9. Virtus KAR Small-Cap Growth (PSGAX)
Return Over Benchmark (% points): 9.53
Expense Ratio: 1.50%
Fund Assets (millions): $926

8. Deutsche Enhanced Commodity Strat (SKSRX)
Return Over Benchmark (% points): 10.02
Expense Ratio: 1.17%
Fund Assets (millions): $2,667

7. T. Rowe Price Media & Telecomms (PRMTX)
Return Over Benchmark (% points): 10.126
Expense Ratio: 0.79%
Fund Assets (millions): $4,401

6. Lazard Global Listed Infrastructure (GLFOX)
Return Over Benchmark (% points): 10.127
Expense Ratio: 1.22%
Fund Assets (millions): $5,106
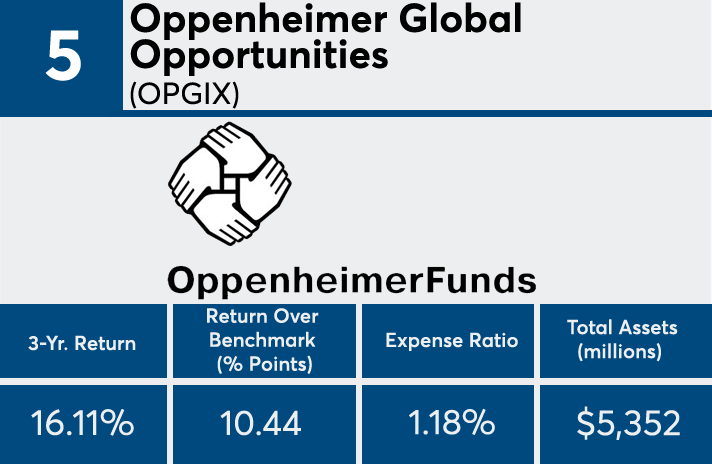
5. Oppenheimer Global Opportunities (OPGIX)
Return Over Benchmark (% points): 10.44
Expense Ratio: 1.18%
Fund Assets (millions): $5,352
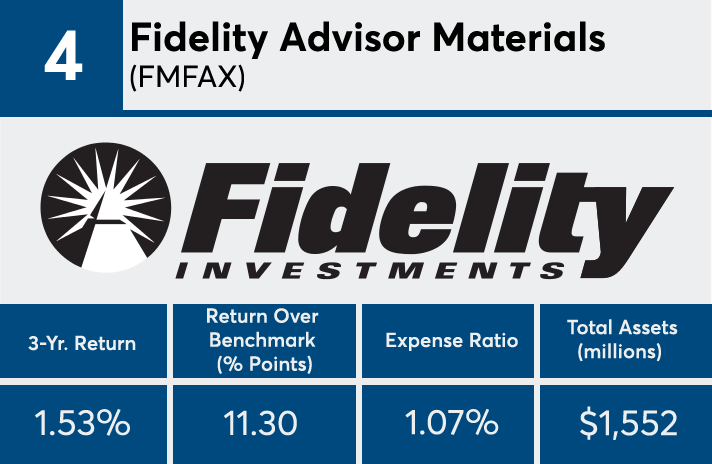
4. Fidelity Advisor Materials (FMFAX)
Return Over Benchmark (% points): 11.30
Expense Ratio: 1.07%
Fund Assets (millions): $1,552
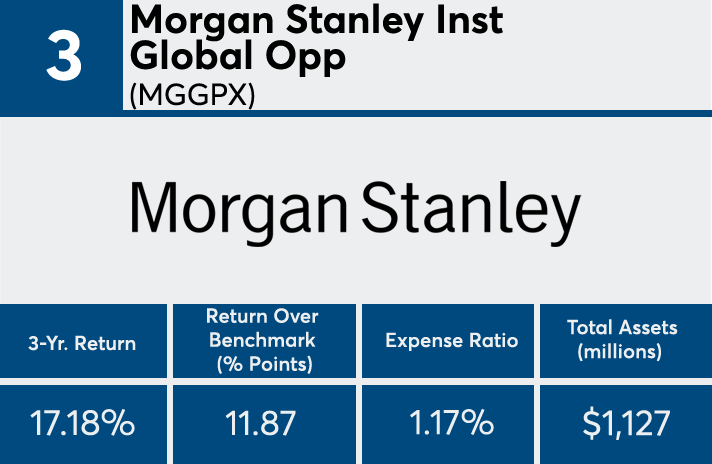
3. Morgan Stanley Inst Global Opp (MGGPX)
Return Over Benchmark (% points): 11.87
Expense Ratio: 1.17%
Fund Assets (millions): $1,127
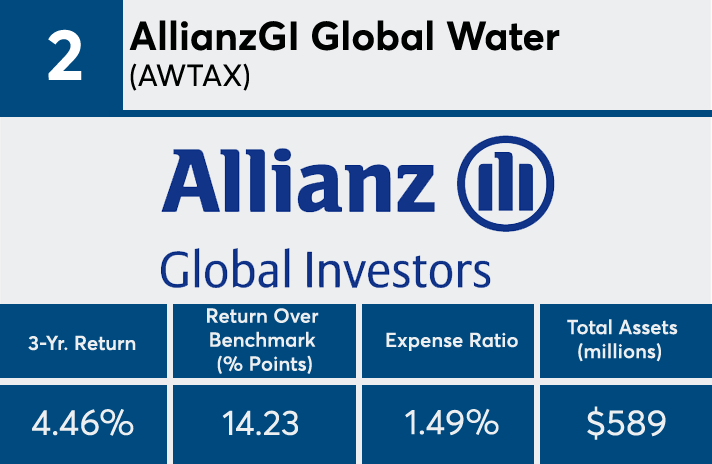
2. AllianzGI Global Water (AWTAX)
Return Over Benchmark (% points): 14.23
Expense Ratio: 1.49%
Fund Assets (millions): $589
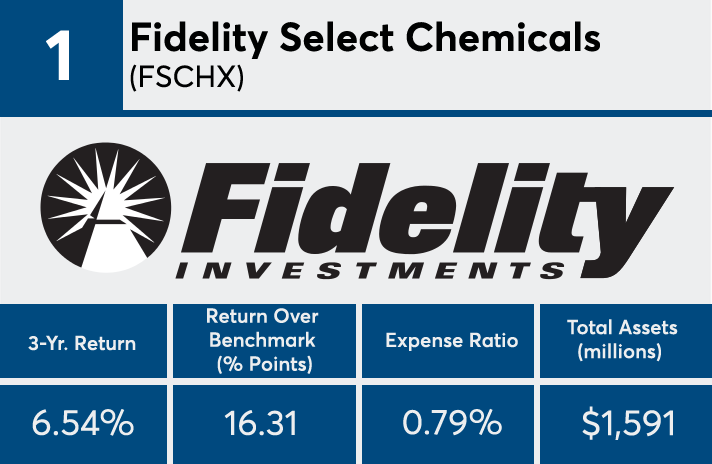
1. Fidelity Select Chemicals (FSCHX)
Return Over Benchmark (% points): 16.31
Expense Ratio: 0.79%
Fund Assets (millions): $1,591


