Indeed, of the 20 top mutual funds with at least $500 million in assets, 12 were focused on foreign assets, with 10 even more narrowly focused on emerging markets. Of the other eight funds, six were focused on tech.
Overall, these short-term winners have posted returns ranging up to 57% year to date.
The eye-popping returns haven’t come cheap. Expense ratios ranged from 54 basis points to 1.58%, with an average of 1.08%. With emerging markets investments, higher expenses are often expected, but can be a shock to some in an era of ever-declining fees.
To be sure, many advisors and clients found healthy gains in the inexpensive world of passive investing. The S&P 500 ETF from Vanguard has returned more than 19% year to date at a cost of just 4 basis points.
To check out this year’s winners – plus how they’ve fared over three years – click through the list. All data from Morningstar.

20. JHancock Emerging Markets Equity (JEMGX)
3-Yr. Return: N/A
Expense Ratio: 1.18%
Net Assets (millions): $1,074

19. Columbia Seligman Global Tech (SHGTX)
3-Yr. Return: 22.75%
Expense Ratio: 1.37%
Net Assets (millions): $1,251

18. Franklin DynaTech (FKDNX)
3-Yr. Return: 15.22%
Expense Ratio: 0.91%
Net Assets (millions): $4,334

17. Ivy Emerging Markets Equity (IPOAX)
3-Yr. Return: 10.61%
Expense Ratio: 1.58%
Net Assets (millions): $2,035

16. Vanguard International Growth Inv (VWIGX)
3-Yr. Return: 11.21%
Expense Ratio: 0.46%
Net Assets (millions): $32,928

15. City National Rochdale Emerg Mkts (RIMIX)
3-Yr. Return: 11.14%
Expense Ratio: 1.63%
Net Assets (millions): $1,698

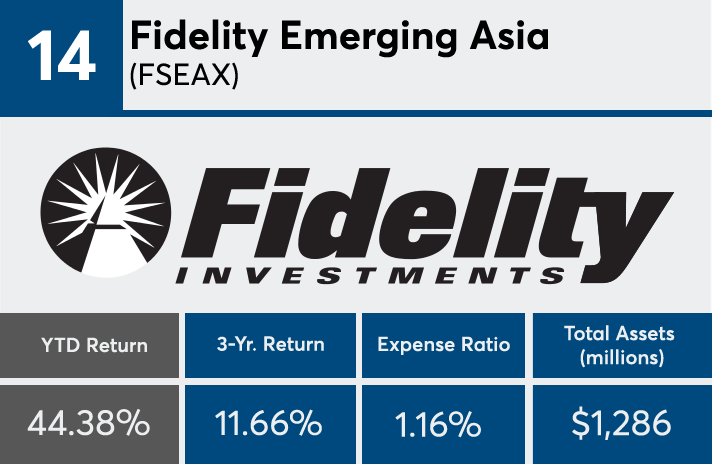
14. Fidelity Emerging Asia (FSEAX)
3-Yr. Return: 11.66%
Expense Ratio: 1.16%
Net Assets (millions): $1,286

13. American Century Emerging Markets Inv (TWMIX)
3-Yr. Return: 10.70%
Expense Ratio: 1.29%
Net Assets (millions): $1,585

12. Transamerica Capital Growth (IALAX)
3-Yr. Return: 15.03%
Expense Ratio: 1.23%
Net Assets (millions): $856

11. Fidelity Emerging Markets (FEMKX)
3-Yr. Return: 8.69%
Expense Ratio: 1.01%
Net Assets (millions): $4,850

10. VALIC Company I Science & Technology (VCSTX)
3-Yr. Return: 18.28%
Expense Ratio: 0.99%
Net Assets (millions): $1,310

9. VanEck Emerging Markets (GBFAX)
3-Yr. Return: 6.27%
Expense Ratio: 1.53%
Net Assets (millions): $1,894

8. Janus Henderson Global Technology (JAGTX)
3-Yr. Return: 20.28%
Expense Ratio: 0.95%
Net Assets (millions): $2,290

7. Baillie Gifford EAFE 3 (BGEUX)
3-Yr. Return: N/A
Expense Ratio: 0.54%
Net Assets (millions): $2,966

6. T. Rowe Price Global Technology (PRGTX)
3-Yr. Return: 23.71%
Expense Ratio: 0.90%
Net Assets (millions): $6,177

5. Oppenheimer Global Opportunities (OPGIX)
3-Yr. Return: 22.83%
Expense Ratio: 1.19%
Net Assets (millions): $6,872

4. Fidelity China Region (FHKCX)
3-Yr. Return: 11.34%
Expense Ratio: 1.02%
Net Assets (millions): $1,381

3. Baillie Gifford Emerging Markets (BGEDX)
3-Yr. Return: N/A
Expense Ratio: 0.71%
Net Assets (millions): $2,066

2. Fidelity Select Technology (FSPTX)
3-Yr. Return: 22.93%
Expense Ratio: 0.77%
Net Assets (millions): $6,683

1. Matthews China Investor (MCHFX)
3-Yr. Return: 14.22%
Expense Ratio: 1.18%
Net Assets (millions): $902


