
Beyond ever-present concerns about the party ending abruptly, more recently, many advisors and clients fret that President Trump’s call for tariffs on steel and aluminum imports could lead to a trade war that will will depress global investing.
Indeed, the Vanguard FTSE EM ETF is up 3.3% year-to-date, but incurred a loss of 3.4% for the past week. Shorter timeframes are usually less meaningful, but in this case, could reflect a turning point in emerging markets.
The president’s threat to initiate a trade war could rein in, or even reverse, global growth, says Mark Hamrick, a senior economic analyst for Bankrate. It’s hard to construct a scenario that’s positive for the investment markets unless the threats evaporate and nothing actually happens, he adds.
Taking a longer view, Hamrick notes that emerging markets have had a good run in recent years after severe pullbacks a decade ago.
Scroll through to see the 20 best-performing emerging markets equity funds for the past year. There is also data on each fund’s three-year returns, expense ratios and total assets. Funds with less than $100 million in assets were excluded. All data from Morningstar Direct.

20. Fidelity SAI Emerging Markets Index (FERGX)
3-Yr. Return: N/A
Expense Ratio: 0.08%
Total Assets (millions): $3,654.63
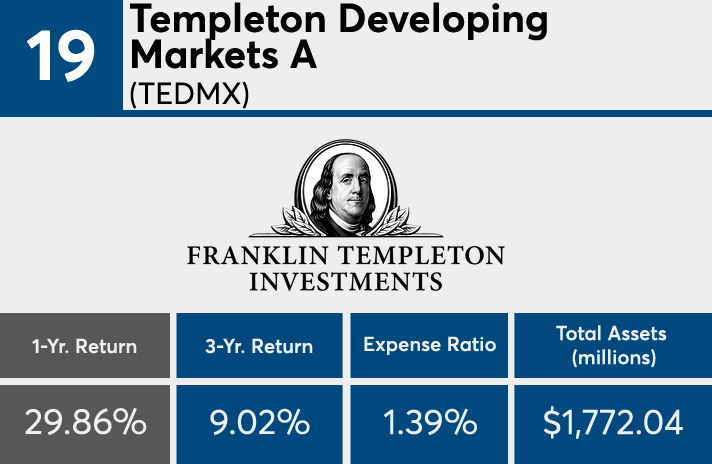
19. Templeton Developing Markets A (TEDMX)
3-Yr. Return: 9.02%
Expense Ratio: 1.39%
Total Assets (millions): $1,772.04

18. Deutsche Emerging Markets Equity S (SEMGX)
3-Yr. Return: 9.63%
Expense Ratio: 1.00%
Total Assets (millions): $114.93

17. Strategic Advisers Emerging Markets (FSAMX)
3-Yr. Return: 8.85%
Expense Ratio: 1.07%
Total Assets (millions): $5,070.61
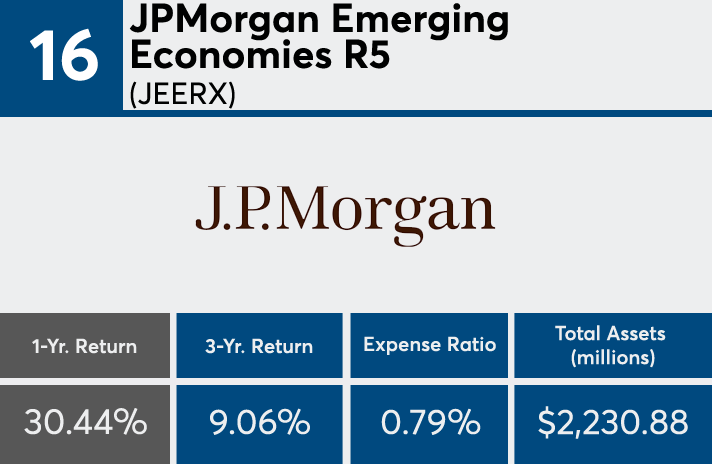
16. JPMorgan Emerging Economies R5 (JEERX)
3-Yr. Return: 9.06%
Expense Ratio: 0.79%
Total Assets (millions): $2,230.88

15. GuideMark Emerging Markets Service (GMLVX)
3-Yr. Return: 11.02%
Expense Ratio: 1.70%
Total Assets (millions): $109.12

14. City National Rochdale Emerg Mkts N (RIMIX)
3-Yr. Return: 10.66%
Expense Ratio: 1.62%
Total Assets (millions): $1,762.26
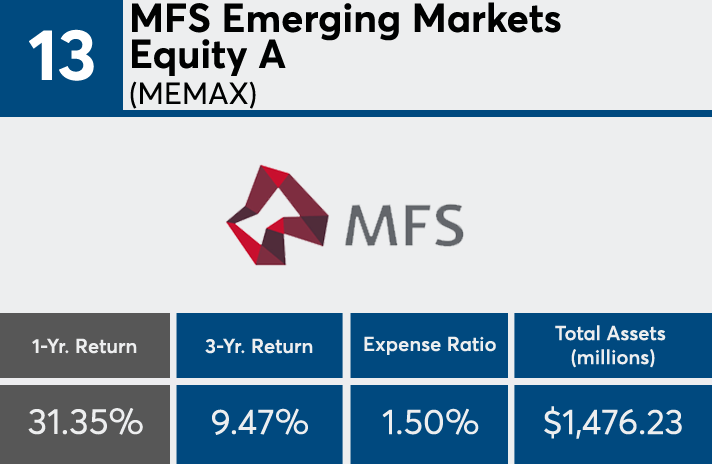
13. MFS Emerging Markets Equity A (MEMAX)
3-Yr. Return: 9.47%
Expense Ratio: 1.50%
Total Assets (millions): $1,476.23
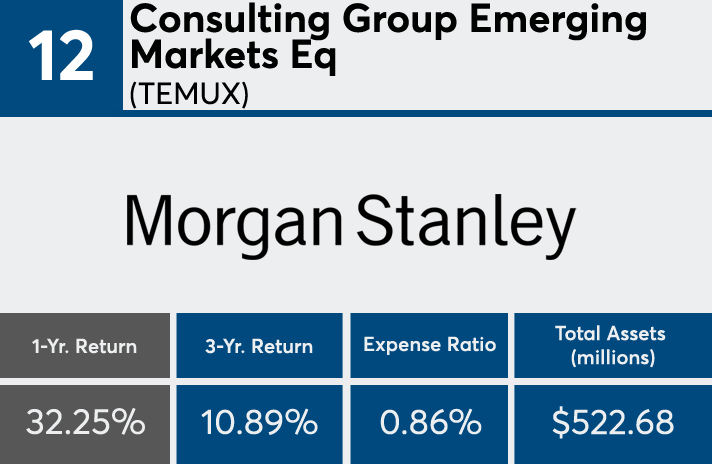
12. Consulting Group Emerging Markets Eq (TEMUX)
3-Yr. Return: 10.89%
Expense Ratio: 0.86%
Total Assets (millions): $522.68

11. Hartford Schroders Emerging Mkts Eq I (SEMNX)
3-Yr. Return: 10.17%
Expense Ratio: 1.27%
Total Assets (millions): $3,077.27

10. Ivy Emerging Markets Equity A (IPOAX)
3-Yr. Return: 11.75%
Expense Ratio: 1.58%
Total Assets (millions): $2,637.32

9. VALIC Company I Emerg Economies (VCGEX)
3-Yr. Return: 10.39%
Expense Ratio: 0.94%
Total Assets (millions): $891.67
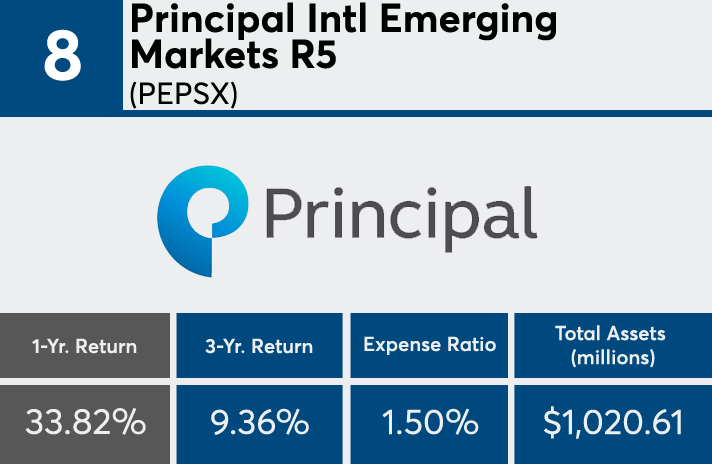
8. Principal Intl Emerging Markets R5 (PEPSX)
3-Yr. Return: 9.36%
Expense Ratio: 1.50%
Total Assets (millions): $1,020.61

7. VY JPMorgan Emerging Markets Equity S (IJPIX)
3-Yr. Return: 9.75%
Expense Ratio: 1.50%
Total Assets (millions): $610.21

6. Victory Sophus Emerging Markets A (GBEMX)
3-Yr. Return: 11.50%
Expense Ratio: 1.34%
Total Assets (millions): $277.12

5. T. Rowe Price Emerging Markets Stock (PRMSX)
3-Yr. Return: 11.92%
Expense Ratio: 1.26%
Total Assets (millions): $12,161.31

4. BNY Mellon Emerging Markets M (MEMKX)
3-Yr. Return: 9.91%
Expense Ratio: 1.42%
Total Assets (millions): $1,063.15

3. Fidelity Emerging Markets (FEMKX)
3-Yr. Return: 10.05%
Expense Ratio: 0.97%
Total Assets (millions): $5,540.47
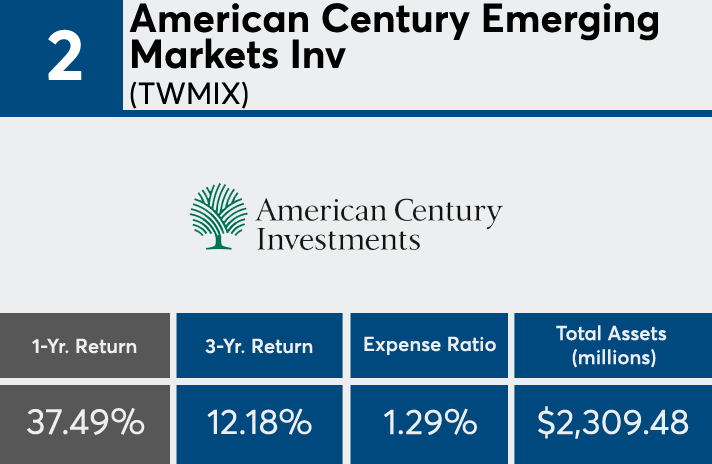
2. American Century Emerging Markets Inv (TWMIX)
3-Yr. Return: 12.18%
Expense Ratio: 1.29%
Total Assets (millions): $2,309.48

1. VanEck Emerging Markets A (GBFAX)
3-Yr. Return: 8.97%
Expense Ratio: 1.53%
Total Assets (millions): $2,200.48


