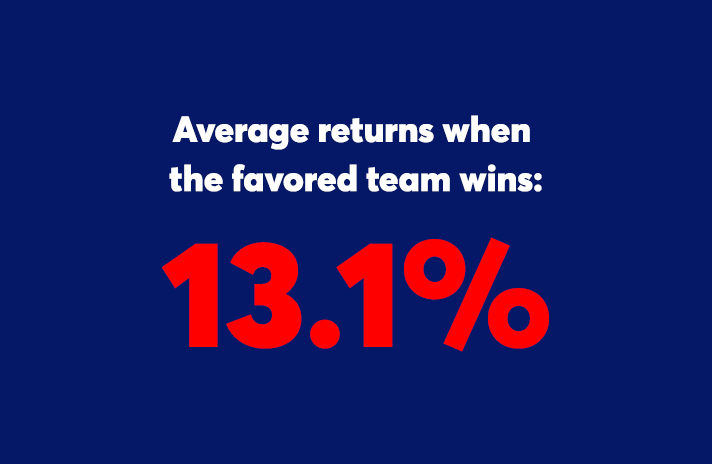
While correlation certainly does not equal causation, a light-hearted look at Super Bowl history and the S&P 500 can yield stats that are of interest to football and finance fans alike.
For example, the Patriots are 5-4 in their nine Super Bowl appearances. When New England wins, the average market return in subsequent years is 3.4%, according to data from S&P Global Market Intelligence. Philadelphia is 0-2 in their two Super Bowl appearances, and the market's response was indifferent, with an average of a 0% return – losing 4.9% after Super Bowl XV but gaining 4.9% after Super Bowl XXXIX. However, Eagles fans may be pleased to know (OK, they will be pleased) that average returns are 7.7% when the Pats lose.
Whether you're a tried and true member of Pats Nation or flying high with Nick Foles and the Eagles faithful (or just "rooting for" halftime show performer Justin Timberlake), these fun stats can both stoke excitement for the Big Game and keep you in the mindset to return to working with clients on Monday. Because unlike leftover nachos, stats are always still great the next day (and next year).
Click through to read more stats about the S&P 500 and Super Bowl history. All data from S&P Global Market Intelligence.

When the returning champs win, the S&P 500 wins

Big offense, big returns

Good news for Eagles fans

Markets seem to prefer the O.G. conference

Everyone loves a rematch

Home team advantage?

Shadow under the dome

Markets are warm to cold venues

What are the odds?


