Seven of the largest asset managers reported a record $50 billion in combined redemptions during the third quarter, mostly from active funds, according to Bloomberg News. As a result, Brad Morrow, the head of research for the Americas at Willis Towers Watson, suggests the industry is on the heels of massive consolidation.
"You're going to see niche players with competitive advantages … implement interesting strategies for portfolios, but I think who will be hit hardest are the more traditional managers that don't have the size, scale or operational efficiencies to maintain lower costs," Morrow explained. "It is going to be a tougher world for those."
Scroll through to see the 20 largest open-end funds ranked by their net share class flows over the last five years, as of Oct. 28. All data is from Morningstar.

Vanguard Total Intl Stock Index Inv (VGTSX)
5-Yr. Return: 1.24%
Expense Ratio: 0.19%
Net Assets (millions): $225,971

Vanguard Total Bond Market II Idx Inv (VTBIX)
5-Yr. Return: 3.03%
Expense Ratio: 0.09%
Net Assets (millions): $109,049

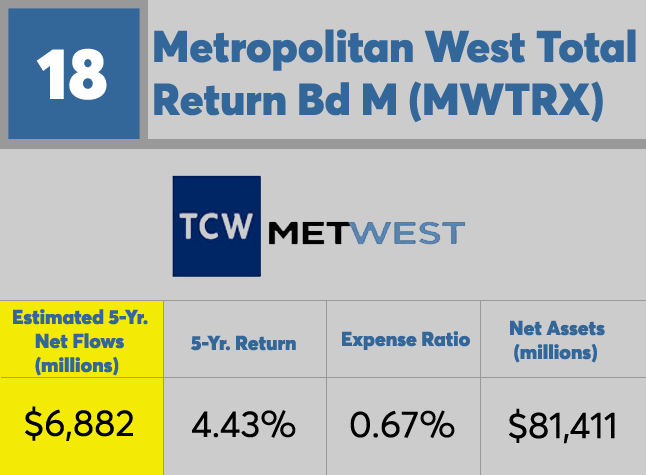
Metropolitan West Total Return Bd M (MWTRX)
5-Yr. Return: 4.43%
Expense Ratio: 0.67%
Net Assets (millions): $81,411

Vanguard Institutional Index I (VINIX)
5-Yr. Return: 12.54%
Expense Ratio: 0.04%
Net Assets (millions): $208,758

American Funds American Balanced A (ABALX)
5-Yr. Return: 9.83%
Expense Ratio: 0.58%
Net Assets (millions): $97,651

Franklin Income A (FKINX)
5-Yr. Return: 5.09%
Expense Ratio: 0.61%
Net Assets (millions): $79,657

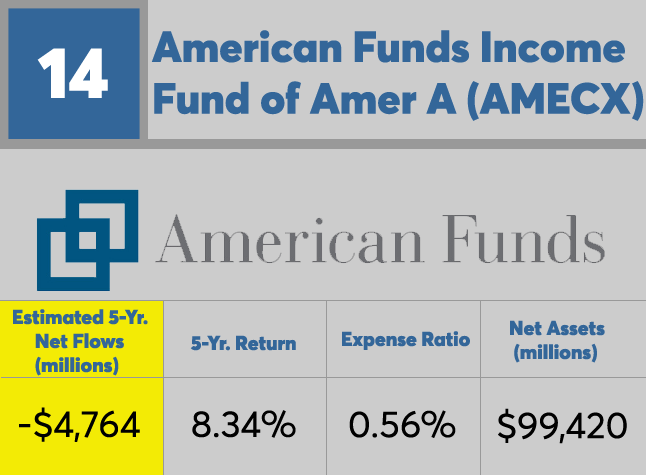
American Funds Income Fund of Amer A (AMECX)
5-Yr. Return: 8.34%
Expense Ratio: 0.56%
Net Assets (millions): $99,420

American Funds Capital Income Bldr A (CAIBX)
5-Yr. Return: 6.46%
Expense Ratio: 0.59%
Net Assets (millions): $99,575

Vanguard Total Bond Market Index Inv (VBMFX)
5-Yr. Return: 3.02%
Expense Ratio: 0.16%
Net Assets (millions): $174,848

American Funds Washington Mutual A (AWSHX)
5-Yr. Return: 12.02%
Expense Ratio: 0.58%
Net Assets (millions): $80,904

American Funds Europacific Growth A (AEPGX)
5-Yr. Return: 3.63%
Expense Ratio: 0.83%
Net Assets (millions): $124,470

Vanguard Total Stock Mkt Idx Inv (VTSMX)
5-Yr. Return: 12.03%
Expense Ratio: 0.16%
Net Assets (millions): $468,740

American Funds Invmt Co of Amer A (AIVSX)
5-Yr. Return: 10.69%
Expense Ratio: 0.58%
Net Assets (millions): $76,849

American Funds Capital World Growth & Income A (CWGIX)
5-Yr. Return: 6.95%
Expense Ratio: 0.77%
Net Assets (millions): $81,986

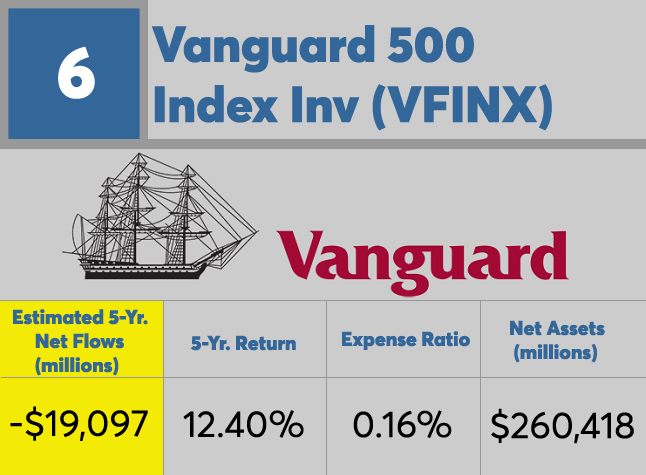
Vanguard 500 Index Inv (VFINX)
5-Yr. Return: 12.40%
Expense Ratio: 0.16%
Net Assets (millions): $260.418

Fidelity 500 Index Investor (FUSEX)
5-Yr. Return: 12.48%
Expense Ratio: 0.09%
Net Assets (millions): $102,856

Vanguard Wellington Inv (VWELX)
5-Yr. Return: 8.98%
Expense Ratio: 0.26%
Net Assets (millions): $92,217

Fidelity Contrafund (FCNTX)
5-Yr. Return: 12.68%
Expense Ratio: 0.71%
Net Assets (millions): $108,379

American Funds Growth Fund of Amer A (AGTHX)
5-Yr. Return: 12.05%
Expense Ratio: 0.65%
Net Assets (millions): $143,470

PIMCO Total Return Instl (PTTRX)
5-Yr. Return: 3.52%
Expense Ratio: 0.46%
Net Assets (millions): $84,392


