
When we looked at the 20 best-performing target-date funds over the past five years that had 2020 as the specified retirement year, annualized returns ranged from 5.7% to 8%. Expense ratios, among other factors, varied widely, too.
“Not all target-date funds are created alike, even if they have the same target date,” says Greg McBride, chief financial analyst at financial website Bankrate. “The biggest variation in performance is attributable to different asset allocations — some funds may have more stocks and fewer bonds, or vice versa, compared to competitors,” he says.
For instance, T. Rowe Price has always had one of the more equity-heavy glide paths of any of the target-date options, notes Christine Benz, director of personal finance at Morningstar. “More risk has translated into higher returns, but that advantage obviously would become a detriment in an equity-market correction,” she says. Despite the recent volatility in equity markets, T. Rowe Price was able to maintain one of the highest spots on this five-year list.
One key consideration with near-dated target funds is that they are managed with the assumption that investors won’t liquidate the day they retire, Benz says. Sometimes funds are criticized for being too aggressive – making them vulnerable to losses in the period just prior to retirement – but since most investors are planning retirements that could last 20 to 30 years, it's reasonable that a “healthy portion of the assets for such a long time horizon would be invested in stocks,” she says.
Fund expenses are another ever-present consideration. Indeed, expense ratios on this list range from 10 basis points to a relatively high 74 basis points.
Balancing the attributes of these funds, they can pose challenges for retirees making withdrawals, according to a research report Benz wrote that she pointed to for additional detail. Since investors can’t specify where their withdrawals come from, “when the retiree needs to sell shares to take a distribution, that money will come out of stocks and bonds in the same proportion the manager is holding in the all-in-one fund. If either stocks or bonds are going down at that time of the distribution, the retiree will be essentially locking in the losses. It's impossible to be strategic about what gets sold,” according to the research report.
That and other reasons mean “investors shouldn’t pick a target-date fund on name only. Look under the hood and make sure the asset allocation among stocks, bonds, cash and alternative investments is something you’re comfortable with,” McBride says.
Scroll through to see the top-performing 2020 target-date funds over the past five years. We also included each fund’s one-year return, expense ratio and total assets. We included institutional funds since many advisors advise guide clients on the funds available through their 401(k) or 403(b) plans. Funds with less than $100 million in assets were excluded. All data from Morningstar Direct.

20. BlackRock LifePath Dyn 2020 Instl (STLCX)
5-Yr. Return: 5.72%
Expense Ratio: 0.66%
Total Assets (millions): $345.99

19. BlackRock LifePath Index 2020 K (LIMKX)
5-Yr. Return: 5.96%
Expense Ratio: 0.12%
Total Assets (millions): $2,530.73

18. American Century One Choice 2020 I (ARBSX)
5-Yr. Return: 6.10%
Expense Ratio: 0.57%
Total Assets (millions): $2,140.21

17. Nationwide Destination 2020 R6 (NWFIX)
5-Yr. Return: 6.32%
Expense Ratio: 0.39%
Total Assets (millions): $228.92

16. MassMutual RetireSMART 2020 Service (MRTSX)
5-Yr. Return: 6.43%
Expense Ratio: 0.73%
Total Assets (millions): $452.17
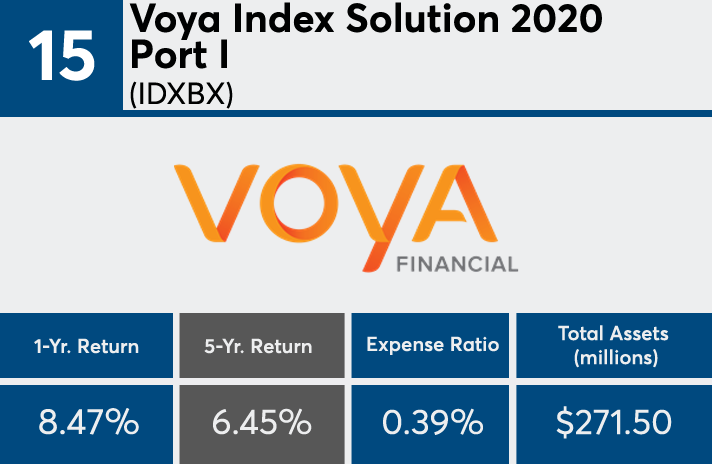
15. Voya Index Solution 2020 Port I (IDXBX)
5-Yr. Return: 6.45%
Expense Ratio: 0.39%
Total Assets (millions): $271.50
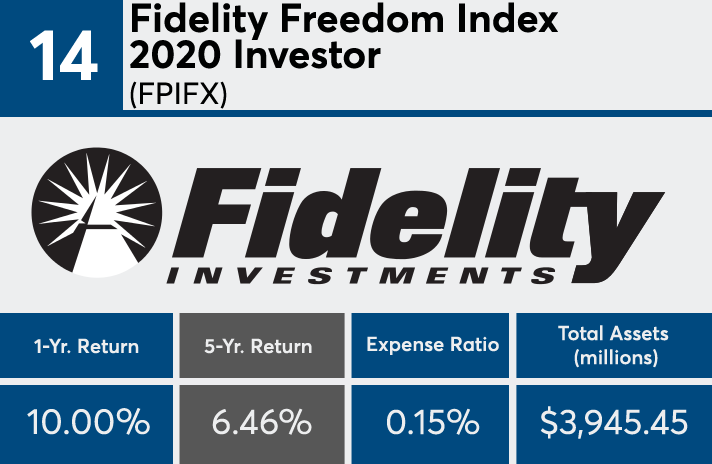
14. Fidelity Freedom Index 2020 Investor (FPIFX)
5-Yr. Return: 6.46%
Expense Ratio: 0.15%
Total Assets (millions): $3,945.45

13. JPMorgan SmartRetirement Blend 2020 R6 (JSYRX)
5-Yr. Return: 6.57%
Expense Ratio: 0.29%
Total Assets (millions): $712.99

12. Schwab Target 2020 (SWCRX)
5-Yr. Return: 6.65%
Expense Ratio: 0.39%
Total Assets (millions): $576.91

11. JPMorgan SmartRetirement 2020 R5 (JTTIX)
5-Yr. Return: 6.70%
Expense Ratio: 0.55%
Total Assets (millions): $6,808.78

10. Principal LifeTime 2020 Institutional (PLWIX)
5-Yr. Return: 6.85%
Expense Ratio: 0.70%
Total Assets (millions): $4,890.40
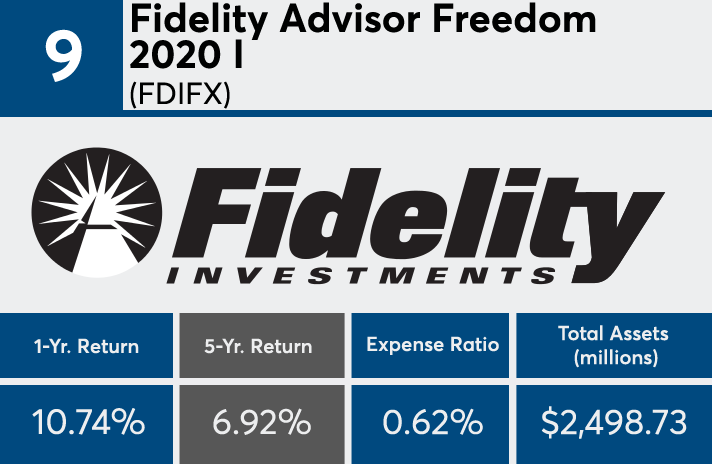
9. Fidelity Advisor Freedom 2020 I (FDIFX)
5-Yr. Return: 6.92%
Expense Ratio: 0.62%
Total Assets (millions): $2,498.73

8. MainStay Retirement 2020 I (MYRTX)
5-Yr. Return: 6.96%
Expense Ratio: 0.74%
Total Assets (millions): $125.34

7. TIAA-CREF Lifecycle Index 2020 Instl (TLWIX)
5-Yr. Return: 7.08%
Expense Ratio: 0.10%
Total Assets (millions): $1,711.28

6. JHancock Multimanager 2020 Lifetime 1 (JLDOX)
5-Yr. Return: 7.17%
Expense Ratio: 0.60%
Total Assets (millions): $972.60
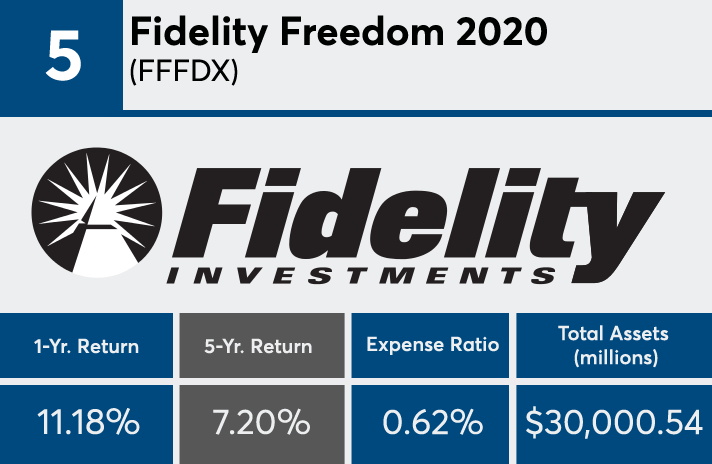
5. Fidelity Freedom 2020 (FFFDX)
5-Yr. Return: 7.20%
Expense Ratio: 0.62%
Total Assets (millions): $30,000.54
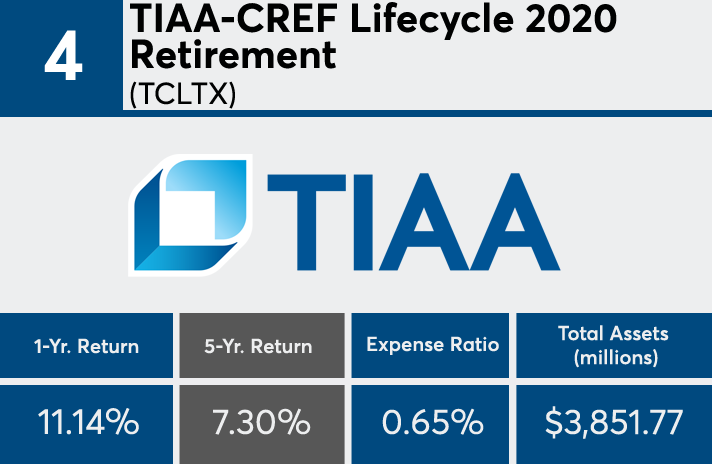
4. TIAA-CREF Lifecycle 2020 Retirement (TCLTX)
5-Yr. Return: 7.30%
Expense Ratio: 0.65%
Total Assets (millions): $3,851.77
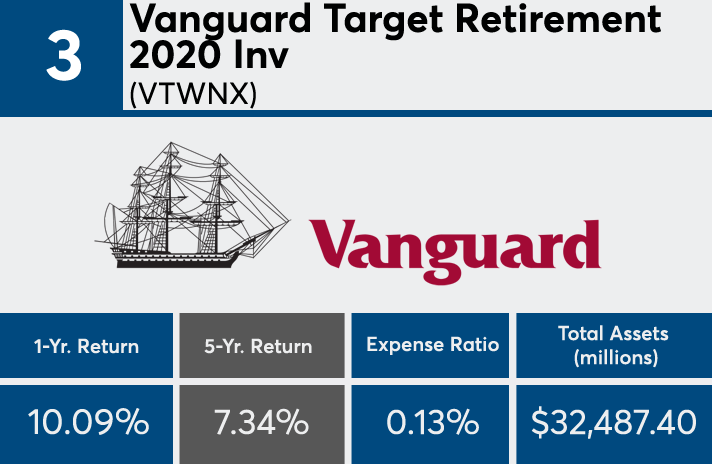
3. Vanguard Target Retirement 2020 Inv (VTWNX)
5-Yr. Return: 7.34%
Expense Ratio: 0.13%
Total Assets (millions): $32,487.40
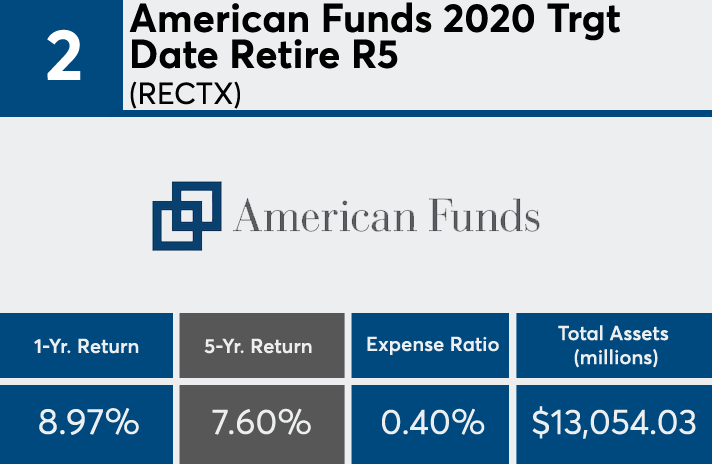
2. American Funds 2020 Trgt Date Retire R5 (RECTX)
5-Yr. Return: 7.60%
Expense Ratio: 0.40%
Total Assets (millions): $13,054.03
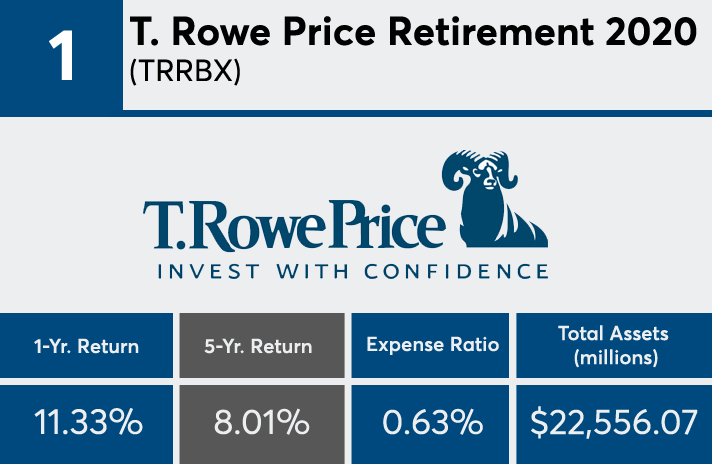
1. T. Rowe Price Retirement 2020 (TRRBX)
5-Yr. Return: 8.01%
Expense Ratio: 0.63%
Total Assets (millions): $22,556.07


