For starters, small-cap companies could benefit from the new tax laws more than large-cap giants, most of which already have a team focused on mitigating taxes, says Tom Roseen, head of Research Services at Lipper.
Moreover, small-caps are less impacted by currency fluctuations, he notes, while large-cap companies (which are generally multinational) might be hurt by a rising dollar, making their goods more expensive for foreign buyers. Additionally, since small-caps tend to be more dependent on local sales and purchases and less impacted by the vagaries of the international markets, they likely won’t be impacted as much as their larger brethren in the advent of a trade war, he says.
With this in mind, we compiled the 20 top-performing small-cap funds ranked by five-year annualized returns. The average five-year metric of these top performers was 17.9%, compared to 13.2% for the S&P 500, as measured by the SPDR S&P 500 ETF (SPY).
More broadly, small-aps have posted a 7.7% return year-to-date, and 17.7% over the past 12 months, as measured by the Russell 2000 index. That compares to 3.4% and 14.7% for SPY over the same time periods.
These returns have not gone unnoticed as investors have injected net new money into small-cap funds for at least seven straight weeks recently, ending May 23, according to Lipper data.
To be sure, investing in small-caps requires more attention from investors than large-caps. Many of the biggest index funds didn’t make this list because this is one area where some stock pickers still beat the averages, Roseen says. While index funds must hold all of the underlying constituents, active managers can try to show off their prowess in stock selection and “earn the elusive small-cap premium often talked about in the academic literature,” Roseen says.
Scroll through to see the top-performing small-cap funds over the past five years. Only funds with at least $100 million in assets — and those with a minimum investment of less than $100,000 — were included. We also show one-year returns, assets and, as usual, expense ratios for each fund. All data from Morningstar Direct.

20. SPDR S&P 600 Small Cap Growth ETF (SLYG)
5-Yr. Return: 14.89%
Expense Ratio: 0.15%
Total Assets (millions): $1,850.99

19. First Trust Dow Jones Sel MicroCap ETF (FDM)
5-Yr. Return: 15.08%
Expense Ratio: 0.60%
Total Assets (millions): $115.56

18. Emerald Growth A (HSPGX)
5-Yr. Return: 15.23%
Expense Ratio: 1.08%
Total Assets (millions): $1,273.48
Front Load: 4.75%

17. Conestoga Small Cap Investors (CCASX)
5-Yr. Return: 15.42%
Expense Ratio: 1.10%
Total Assets (millions): $2,061.58

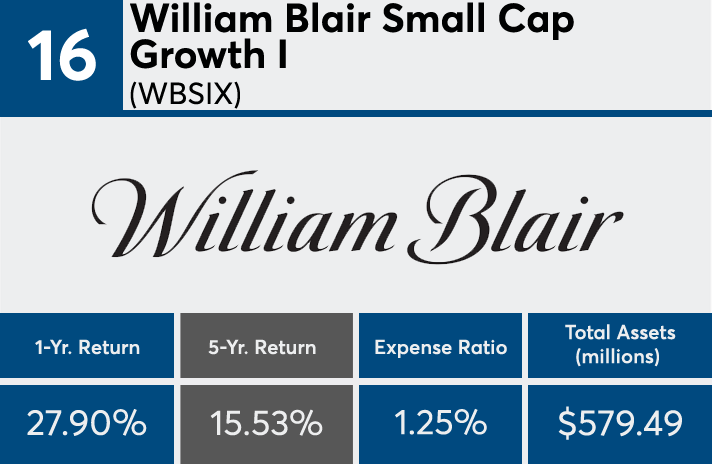
16. William Blair Small Cap Growth I (WBSIX)
5-Yr. Return: 15.53%
Expense Ratio: 1.25%
Total Assets (millions): $579.49

15. First Trust NASDAQ ABA Community Bk ETF (QABA)
5-Yr. Return: 15.76%
Expense Ratio: 0.60%
Total Assets (millions): $356.70

14. Wasatch Micro Cap (WMICX)
5-Yr. Return: 15.85%
Expense Ratio: 1.67%
Total Assets (millions): $417.92

13. TCM Small Cap Growth (TCMSX)
5-Yr. Return: 16.27%
Expense Ratio: 0.96%
Total Assets (millions): $410.35

12. Wasatch Ultra Growth (WAMCX)
5-Yr. Return: 16.70%
Expense Ratio: 1.35%
Total Assets (millions): $161.88

11. Fidelity Small Cap Growth (FCPGX)
5-Yr. Return: 16.75%
Expense Ratio: 1.09%
Total Assets (millions): $4,114.76

10. AMG Managers Cadence Emerging Cos I (MECIX)
5-Yr. Return: 17.27%
Expense Ratio: 0.97%
Total Assets (millions): $129.04

9. Federated Kaufmann Small Cap A (FKASX)
5-Yr. Return: 17.55%
Expense Ratio: 1.36%
Total Assets (millions): $1,315.85
Front Load: 5.50%

8. Hennessy Japan Small Cap Investor (HJPSX)
5-Yr. Return: 17.78%
Expense Ratio: 1.61%
Total Assets (millions): $243.82

7. PowerShares S&P SmallCap Info Tech ETF (PSCT)
5-Yr. Return: 18.66%
Expense Ratio: 0.29%
Total Assets (millions): $417.32

6. Emerald Banking and Finance A (HSSAX)
5-Yr. Return: 19.31%
Expense Ratio: 1.43%
Total Assets (millions): $576.76
Front Load: 4.75%

5. Virtus KAR Small-Cap Growth I (PXSGX)
5-Yr. Return: 20.45%
Expense Ratio: 1.21%
Total Assets (millions): $3,576.02

4. RMB Mendon Financial Services A (RMBKX)
5-Yr. Return: 20.79%
Expense Ratio: 1.33%
Total Assets (millions): $694.26
Front Load: 5.00%

3. SPDR S&P Biotech ETF (XBI)
5-Yr. Return: 21.04%
Expense Ratio: 0.35%
Total Assets (millions): $5,124.95

2. Eventide Healthcare & Life Sciences I (ETIHX)
5-Yr. Return: 22.99%
Expense Ratio: 1.35%
Total Assets (millions): $625.02

1. PowerShares S&P SmallCap Health Care ETF (PSCH)
5-Yr. Return: 24.81%
Expense Ratio: 0.29%
Total Assets (millions): $601.23


