
Managed volatility funds dominate the list of top five-year performers based on returns.
Some of the top performing funds also offer low fees — the SEI Institutional Investments Trust U.S. Managed Volatility Fund, for instance, has an expense ratio of 24 basis points.
Data from Morningstar.
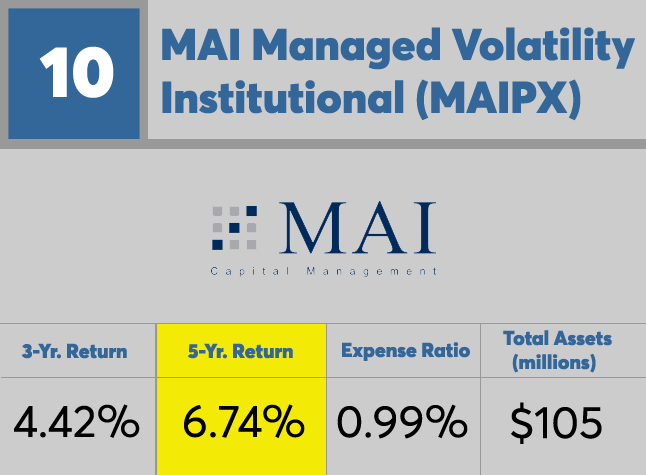
MAI Managed Volatility Institutional (MAIPX)
5-Yr. Return: 6.73%
Expense Ratio: 0.99%
Total Assets (millions): $105
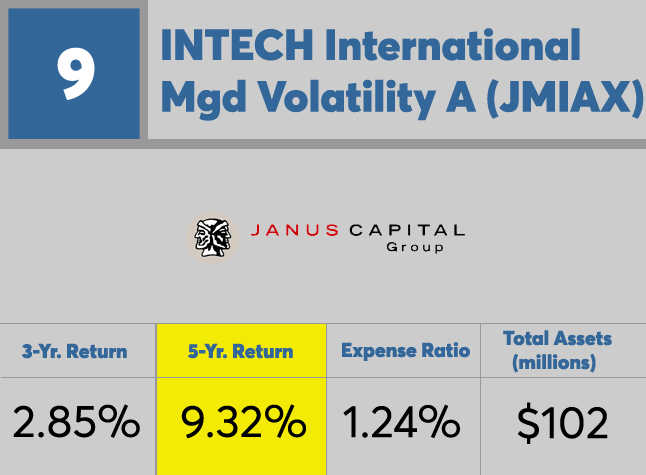
INTECH International Mgd Volatility A (JMIAX)
5-Yr. Return: 9.31%
Expense Ratio: 1.24%
Total Assets (millions): $102

Invesco Global Low Volatility Eq Yld A (GTNDX)
5-Yr. Return: 9.56%
Expense Ratio: 1.48%
Total Assets (millions): $119

SEI Global Managed Volatility A (SIMT) (SVTAX)
5-Yr. Return: 12.53%
Expense Ratio: 1.11%
Total Assets (millions): $1,703
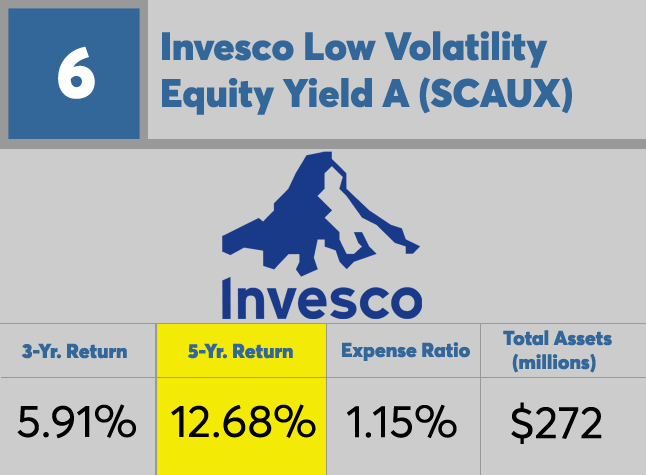
Invesco Low Volatility Equity Yield A (SCAUX)
5-Yr. Return: 12.68%
Expense Ratio: 1.15%
Total Assets (millions): $272
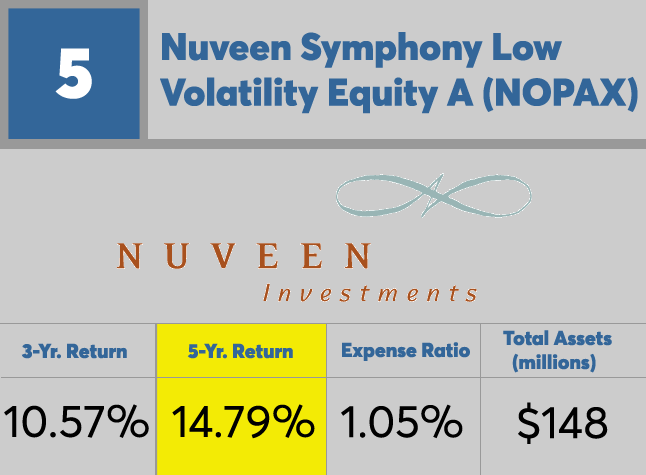
Nuveen Symphony Low Volatility Equity A (NOPAX)
5-Yr. Return: 14.79%
Expense Ratio: 1.05%
Total Assets (millions): $148
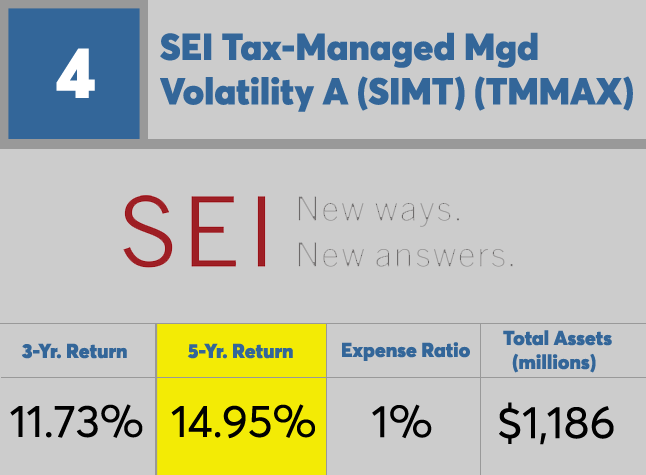
SEI Tax-Managed Mgd Volatility A (SIMT) (TMMAX)
5-Yr. Return: 14.95%
Expense Ratio: 1%
Total Assets (millions): $1,186
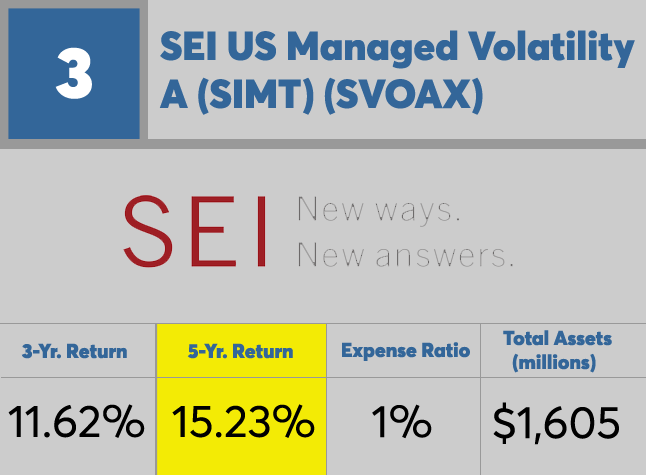
SEI US Managed Volatility A (SIMT) (SVOAX)
5-Yr. Return: 15.23%
Expense Ratio: 1%
Total Assets (millions): $1,605
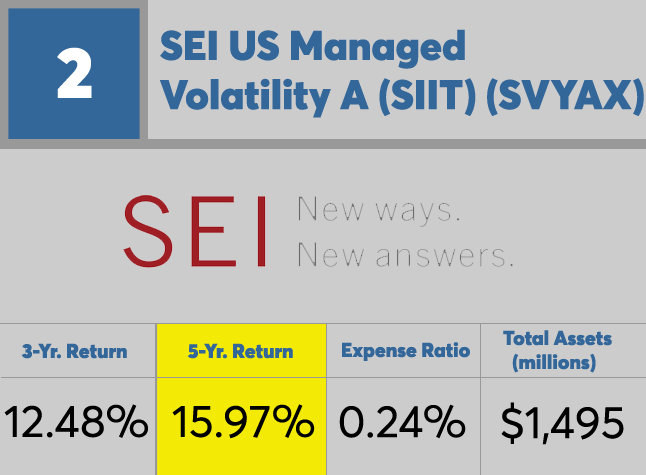
SEI US Managed Volatility A (SIIT) (SVYAX)
5-Yr. Return: 15.97%
Expense Ratio: 0.24%
Total Assets (millions): $1,495
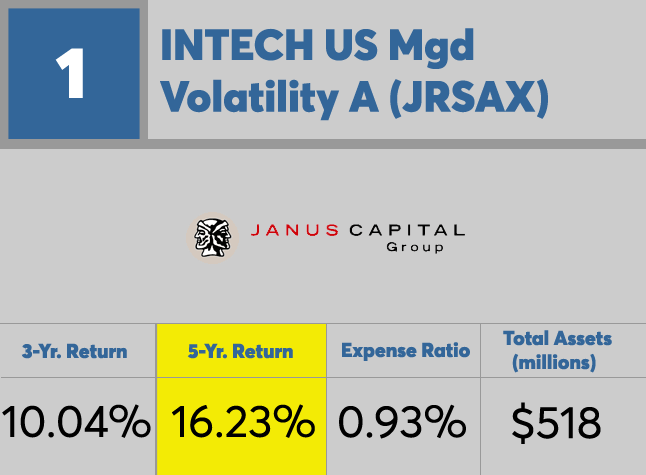
INTECH US Mgd Volatility A (JRSAX)
5-Yr. Return: 16.23%
Expense Ratio: 0.93%
Total Assets (millions): $518


