
Similar to the worst player on an all-star team, the worst-performing mutual funds sometimes still score runs when the overall markets are strong enough. Case in point: The worst-performing international funds in 2017 with at least $100 million in assets were all in the black.
After this month’s slideshow on the
For some context, the long-term average annualized return of U.S. stocks is just 7%, adjusted for inflation (closer to 10% in unadjusted numbers).
When advisors and investors only need a dartboard to get returns like this, it’s easy to think they’re geniuses. But a look at the three-year marks (average among these 20 is 7.8%) will remind them that everything reverts to the mean over time. Still impressive, although hardly apace with the U.S. equity market advance of 13% for the same period. In addition, expense ratios of U.S.-focused funds tend to be considerably cheaper.
Looking forward, some skeptics wonder if emerging markets, a subset of international funds, will be able to maintain their current strides amid a stronger dollar and potential global economic slowdown.
Scroll through to see the 20 worst-performing mutual funds with at least $100 million in assets. As usual, three-year performance and expense ratios are also listed. All data from Morningstar Direct.

20. SEI Global Managed Volatility A (SIIT) (SGMAX)
3-Yr. Returns: N/A
Expense Ratio: 0.25%
Net Assets (millions): $2,078.95
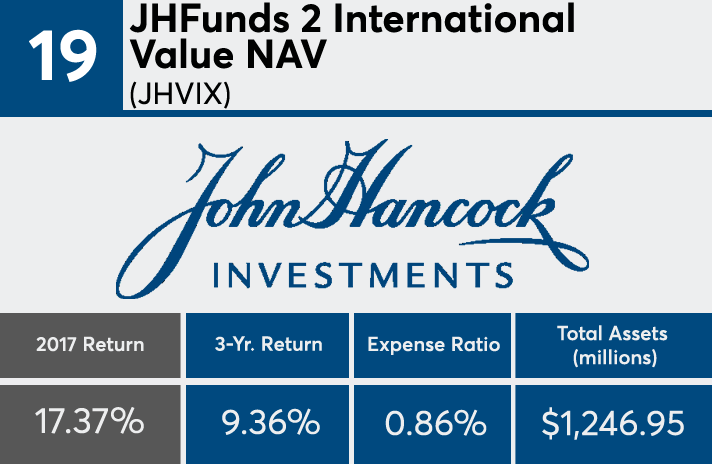
19. JHFunds 2 International Value NAV (JHVIX)
3-Yr. Returns: 9.36%
Expense Ratio: 0.86%
Net Assets (millions): $1,246.95

18. Templeton Foreign A (TEMFX)
3-Yr. Returns: 9.18%
Expense Ratio: 1.19%
Net Assets (millions): $7,530.21

17. VALIC Company I Foreign Value (VCFVX)
3-Yr. Returns: 9.14%
Expense Ratio: 0.80%
Net Assets (millions): $943.41

16. Tweedy, Browne Value (TWEBX)
3-Yr. Returns: 8.28%
Expense Ratio: 1.39%
Net Assets (millions): $603.98

15. BlackRock International Dividend Inv A (BREAX)
3-Yr. Returns: 6.37%
Expense Ratio: 1.10%
Net Assets (millions): $418.16

14. Ivy Cundill Global Value A (ICDAX)
3-Yr. Returns: 7.59%
Expense Ratio: 1.65%
Net Assets (millions): $197.75

13. Janus Henderson European Focus A (HFEAX)
3-Yr. Returns: 5.10%
Expense Ratio: 1.27%
Net Assets (millions): $1,625

12. Invesco Global Low Volatility Eq Yld A (GTNDX)
3-Yr. Returns: 5.33%
Expense Ratio: 1.52%
Net Assets (millions): $107.36
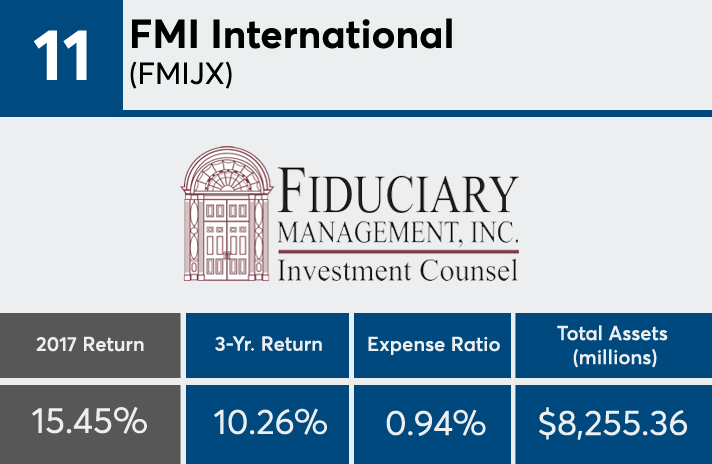
11. FMI International (FMIJX)
3-Yr. Returns: 10.26%
Expense Ratio: 0.94%
Net Assets (millions): $8,255.36

10. Tweedy, Browne Global Value (TBGVX)
3-Yr. Returns: 7.70%
Expense Ratio: 1.38%
Net Assets (millions): $10,540.05

9. Fidelity Canada (FICDX)
3-Yr. Returns: 5.76%
Expense Ratio: 1.02%
Net Assets (millions): $1,226.10

8. First Eagle Overseas A (SGOVX)
3-Yr. Returns: 8.25%
Expense Ratio: 1.14%
Net Assets (millions): $18,765.98

7. Wintergreen Investor (WGRNX)
3-Yr. Returns: 5.66%
Expense Ratio: 2.00%
Net Assets (millions): $348.23
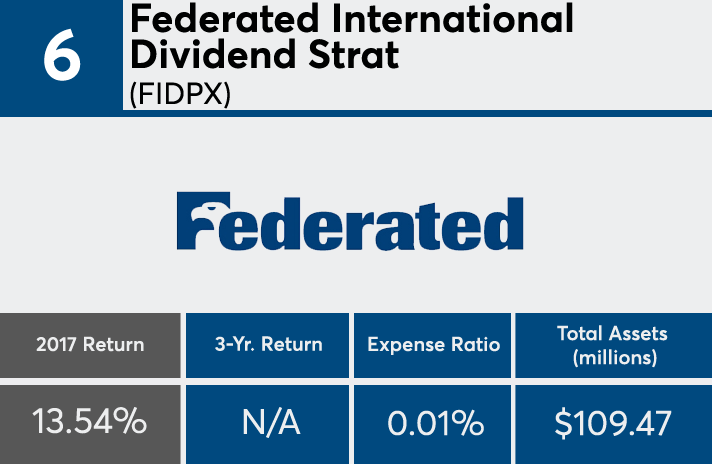
6. Federated International Dividend Strat (FIDPX)
3-Yr. Returns: N/A
Expense Ratio: 0.01%
Net Assets (millions): $109.47
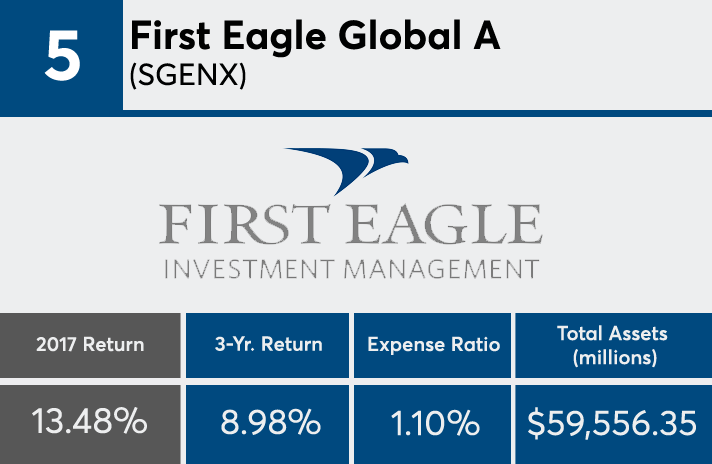
5. First Eagle Global A (SGENX)
3-Yr. Returns: 8.98%
Expense Ratio: 1.10%
Net Assets (millions): $59,556.35

4. Templeton World A (TEMWX)
3-Yr. Returns: 8.60%
Expense Ratio: 1.05%
Net Assets (millions): $4,639.14

3. Brandes International Small Cap Equity A (BISAX)
3-Yr. Returns: 10.70%
Expense Ratio: 1.32%
Net Assets (millions): $1,774.96
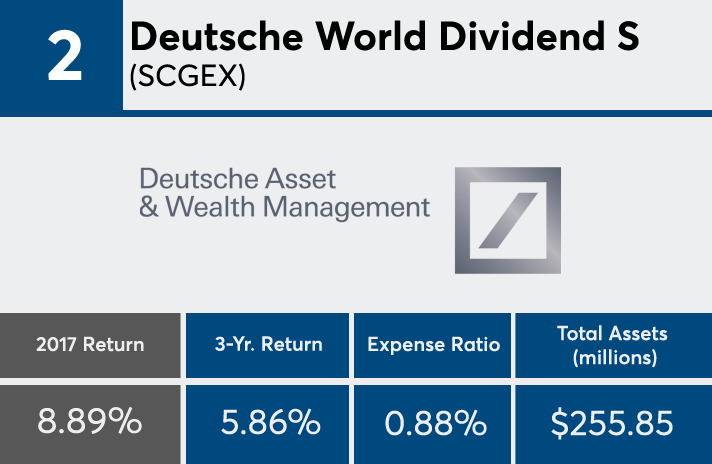
2. Deutsche World Dividend S (SCGEX)
3-Yr. Returns: 5.86%
Expense Ratio: 0.88%
Net Assets (millions): $255.85

1. Cambiar Global Ultra Focus Investor (CAMAX)
3-Yr. Returns: 8.55%
Expense Ratio: 1.35%
Net Assets (millions): $114.54


