Of course, when it comes to investment returns, stability can be sexy, so we’ve gathered all the mutual funds with at least $500 million in assets and standard deviations of less than 3%. We list 20 funds ranked by three-year returns.
These options are not dirt cheap. Expense ratios ranged from about 50 to 100 basis points, and two funds were over the 1% mark. All data from Morningstar.

20. Delaware Tax-Free MN A
Standard Deviation: 2.75%
Expense Ratio: 0.85%
Total Assets (millions): $563

19. JHancock Strategic Income Opps NAV
Standard Deviation: 2.25%
Expense Ratio: 0.66%
Total Assets (millions): $7,368

18. Eaton Vance Glbl Macr Absolute Return
Standard Deviation: 2.33%
Expense Ratio: 1.03%
Total Assets (millions): $5,997

17. USAA VA Bond
Standard Deviation: 2.79%
Expense Ratio: 0.60%
Total Assets (millions): $696

16. American Century Global Bond R5
Standard Deviation: 2.67%
Expense Ratio: 0.64%
Total Assets (millions): $1,319

15. Angel Oak Multi-Strategy Income
Standard Deviation: 2.77%
Expense Ratio: 1.25%
Total Assets (millions): $5,393

14. Putnam Tax Exempt Income
Standard Deviation: 2.89%
Expense Ratio: 0.77%
Total Assets (millions): $920

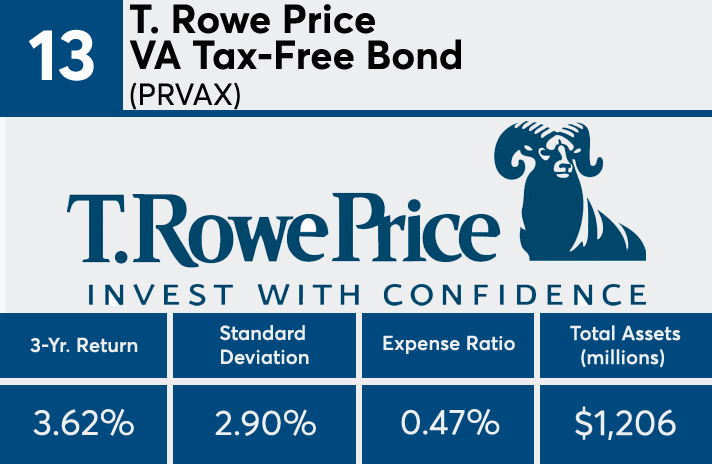
13. T. Rowe Price VA Tax-Free Bond
Standard Deviation: 2.90%
Expense Ratio: 0.47%
Total Assets (millions): $1,206

12. T. Rowe Price MD Tax-Free Bond
Standard Deviation: 2.76%
Expense Ratio: 0.46%
Total Assets (millions): $2,251

11. USAA Tax Exempt Long-Term
Standard Deviation: 2.89%
Expense Ratio: 0.51%
Total Assets (millions): $2,395

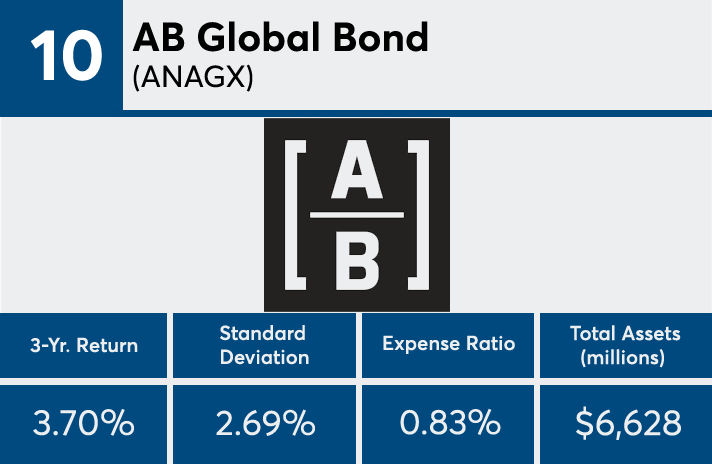
10. AB Global Bond
Standard Deviation: 2.69%
Expense Ratio: 0.83%
Total Assets (millions): $6,628

9. Franklin OH Tax-Free Inc
Standard Deviation: 2.93%
Expense Ratio: 0.63%
Total Assets (millions): $1,608

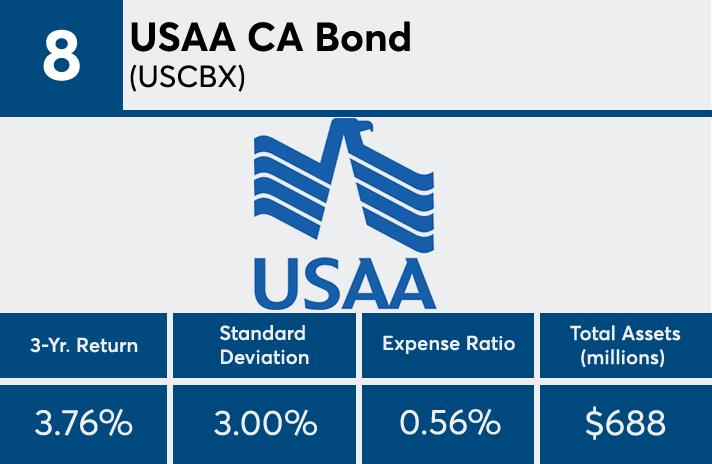
8. USAA CA Bond
Standard Deviation: 3.00%
Expense Ratio: 0.56%
Total Assets (millions): $688

7. Credit Suisse Floating Rate Hi Inc
Standard Deviation: 2.94%
Expense Ratio: 0.95%
Total Assets (millions): $3,461

6. Waddell & Reed Muni Hi-Inc
Standard Deviation: 2.90%
Expense Ratio: 0.88%
Total Assets (millions): $786

5. BNY Mellon Corporate Bond
Standard Deviation: 2.96%
Expense Ratio: 0.56%
Total Assets (millions): $771

4. GMO Opportunistic Income
Standard Deviation: 1.20%
Expense Ratio: 0.46%
Total Assets (millions): $1,250

3. Touchstone Flexible Income
Standard Deviation: 2.77%
Expense Ratio: 0.86%
Total Assets (millions): $711

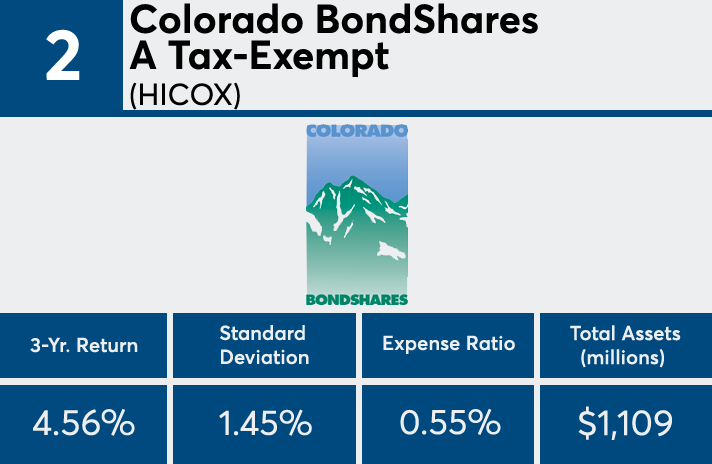
2. Colorado BondShares A Tax-Exempt
Standard Deviation: 1.45%
Expense Ratio: 0.55%
Total Assets (millions): $1,109

1. Performance Trust Strategic Bond
Standard Deviation: 2.15%
Expense Ratio: 0.82%
Total Assets (millions): $949


