
With a stock price acting as the numerator of the ratio, similar to p/e, there’s always a fear the pendulum has swung too far into the territory of overvalued. Indeed, the high point of the S&P 500’s price-to-book ratio, since 2000, was 5.06 reached that March (the same month tech stocks crashed.) The S&P 500’s p/b now stands at 3.18.
We’ve gathered all the funds with more than $500 million in assets and listed those with the highest p/b ratios. The average on this list is 6.57. Whether you and your clients are still bullish on equities, want to take profits or want to look elsewhere entirely, scroll through to see the top 20 mutual funds by p/b ratios. In three cases, our ranking category was a tie even up to two decimal points. We took those to three decimal places, but if they were still a tie, we listed them as such. All data from Morningstar.
Click through above, or read the full text of slideshow below.
--
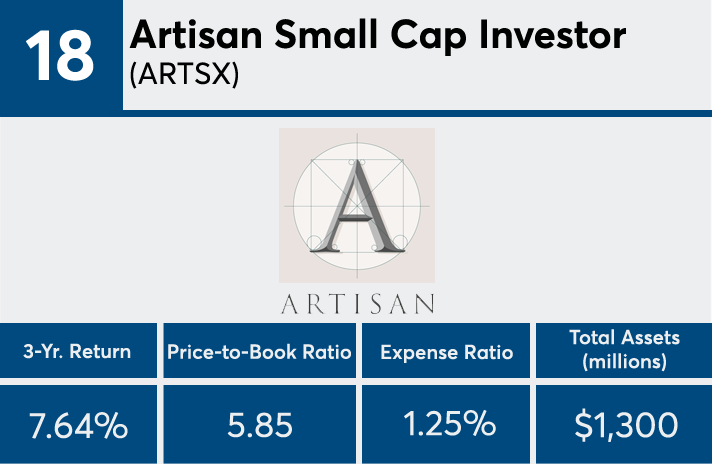
18. Artisan Small Cap Investor (ARTSX)
3-Yr. Return: 7.64%
Price-to-Book Ratio: 5.85
Expense Ratio: 1.25%
Total Assets (millions): $1,300
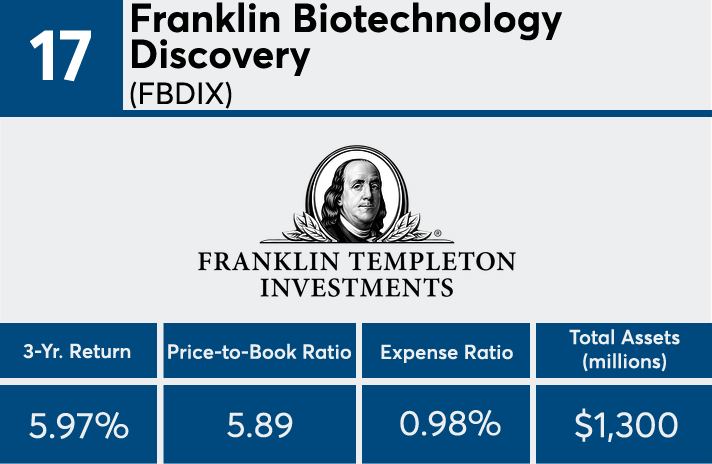
17. Franklin Biotechnology Discovery (FBDIX)
3-Yr. Return: 5.97%
Price-to-Book Ratio: 5.891
Expense Ratio: 0.98%
Total Assets (millions): $1,300
17. T. Rowe Price Global Technology (PRGTX)
3-Yr. Return: 19.80%
Price-to-Book Ratio: 5.891
Expense Ratio: 0.90%
Total Assets (millions): $4,900
16. Multi-Manager Growth Strategies (CSLGX)
3-Yr. Return: 8.73%
Price-to-Book Ratio: 5.90
Expense Ratio: 1.13%
Total Assets (millions): $2,500
15. Nuveen Winslow Large-Cap Growth (NVLIX)
3-Yr. Return: 9.14%
Price-to-Book Ratio: 5.91
Expense Ratio: 0.73%
Total Assets (millions): $641
14. Jensen Quality Growth (JENSX)
3-Yr. Return: 11.18%
Price-to-Book Ratio: 5.99
Expense Ratio: 0.87%
Total Assets (millions): $6,100
13. Franklin DynaTech A (FKDNX)
3-Yr. Return: 11.51%
Price-to-Book Ratio: 6.08
Expense Ratio: 0.90%
Total Assets (millions): $3,700
12. Fidelity Select IT Services (FBSOX)
3-Yr. Return: 12.65%
Price-to-Book Ratio: 6.09
Expense Ratio: 0.79%
Total Assets (millions): $1,700
11. Fidelity Select Leisure (FDLSX)
3-Yr. Return: 9.19%
Price-to-Book Ratio: 6.11
Expense Ratio: 0.79%
Total Assets (millions): $563
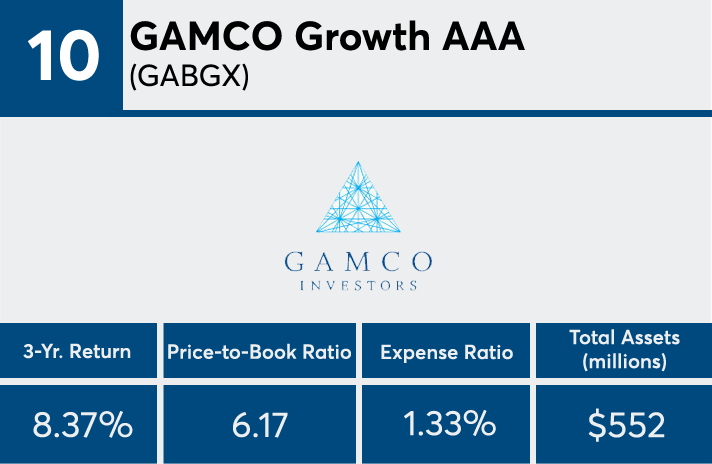
10. GAMCO Growth AAA (GABGX)
3-Yr. Return: 8.37%
Price-to-Book Ratio: 6.17
Expense Ratio: 1.33%
Total Assets (millions): $552
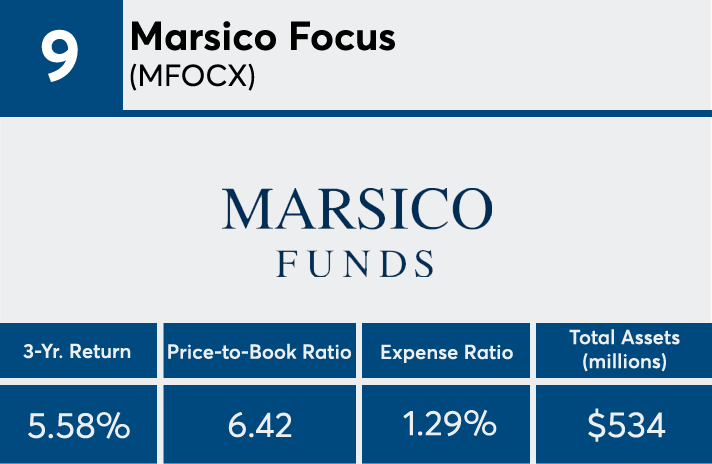
9. Marsico Focus (MFOCX)
3-Yr. Return: 5.58%
Price-to-Book Ratio: 6.42
Expense Ratio: 1.29%
Total Assets (millions): $534
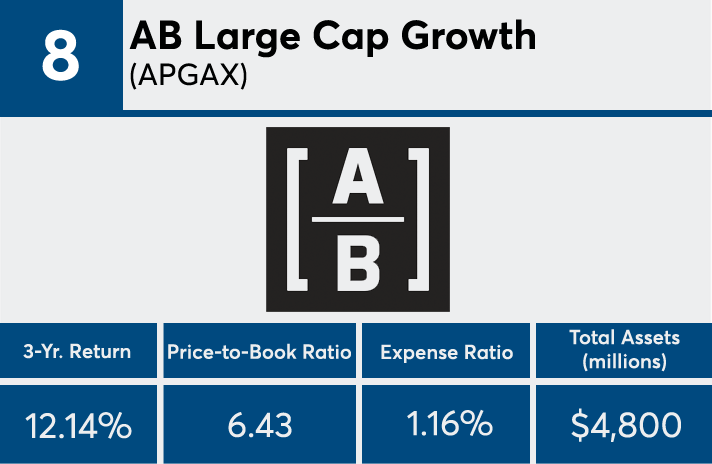
8. AB Large Cap Growth (APGAX)
3-Yr. Return: 12.14%
Price-to-Book Ratio: 6.43
Expense Ratio: 1.16%
Total Assets (millions): $4,800
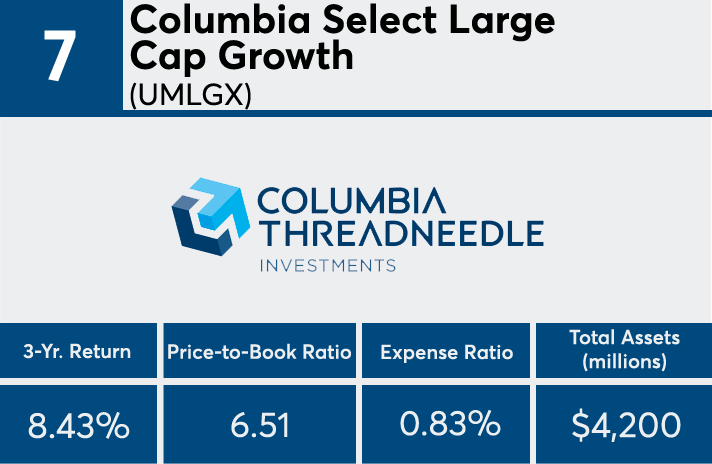
7. Columbia Select Large Cap Growth (UMLGX)
3-Yr. Return: 8.43%
Price-to-Book Ratio: 6.51
Expense Ratio: 0.83%
Total Assets (millions): $4,200
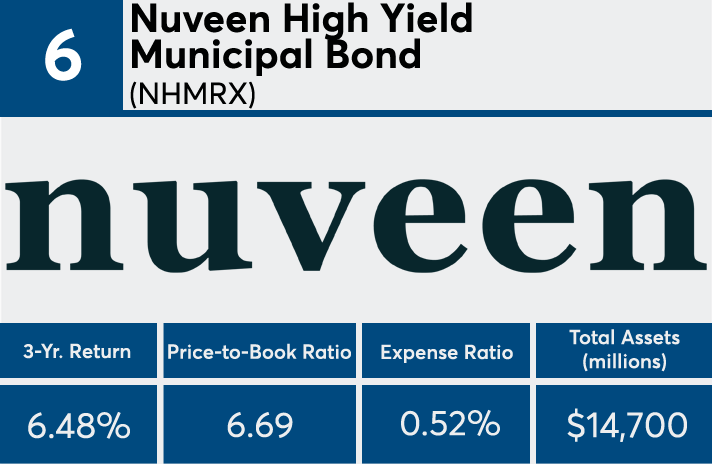
6. Nuveen High Yield Municipal Bond (NHMRX)
3-Yr. Return: 6.48%
Price-to-Book Ratio: 6.69
Expense Ratio: 0.52%
Total Assets (millions): $14,700
5. AB Growth (AGBBX)
3-Yr. Return: 10.48%
Price-to-Book Ratio: 6.77
Expense Ratio: 2.08%
Total Assets (millions): $749
4. Nuveen CA High Yield Municipal Bond (NCHRX)
3-Yr. Return: 6.22%
Price-to-Book Ratio: 6.897
Expense Ratio: 0.64%
Total Assets (millions): $861
4. Nuveen Short Duration Hi Yld Muni Bd (NVHIX)
3-Yr. Return: 3.89%
Price-to-Book Ratio: 6.897
Expense Ratio: 0.54%
Total Assets (millions): $3,500
3. Touchstone Sands Capital Select Growth (PTSGX)
3-Yr. Return: 4.81%
Price-to-Book Ratio: 7.13
Expense Ratio: 1.04%
Total Assets (millions): $2,400
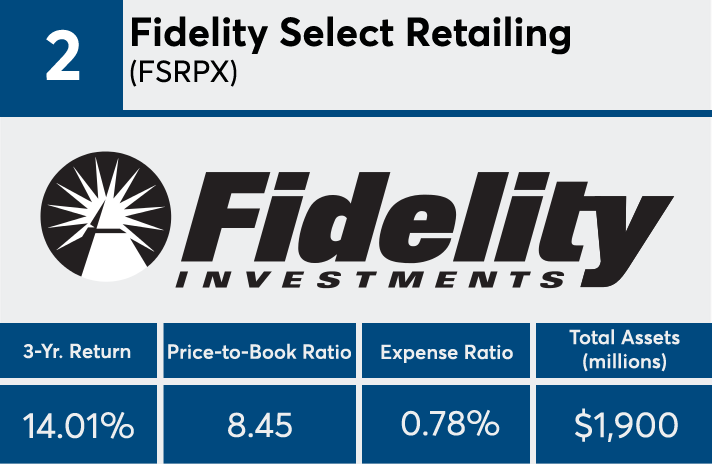
2. Fidelity Select Retailing (FSRPX)
3-Yr. Return: 14.01%
Price-to-Book Ratio: 8.45
Expense Ratio: 0.78%
Total Assets (millions): $1,900
1. Transamerica Capital Growth (IALAX)
3-Yr. Return: 11.68%
Price-to-Book Ratio: 9.40
Expense Ratio: 1.22%
Total Assets (millions): $753
18. Artisan Small Cap Investor (ARTSX)
Price-to-Book Ratio: 5.85
Expense Ratio: 1.25%
Total Assets (millions): $1,300
17. Franklin Biotechnology Discovery (FBDIX)
Price-to-Book Ratio: 5.891
Expense Ratio: 0.98%
Total Assets (millions): $1,300

17. T. Rowe Price Global Technology (PRGTX)
Price-to-Book Ratio: 5.891
Expense Ratio: 0.90%
Total Assets (millions): $4,900

16. Multi-Manager Growth Strategies (CSLGX)
Price-to-Book Ratio: 5.90
Expense Ratio: 1.13%
Total Assets (millions): $2,500

15. Nuveen Winslow Large-Cap Growth (NVLIX)
Price-to-Book Ratio: 5.91
Expense Ratio: 0.73%
Total Assets (millions): $641

14. Jensen Quality Growth (JENSX)
Price-to-Book Ratio: 5.99
Expense Ratio: 0.87%
Total Assets (millions): $6,100

13. Franklin DynaTech A (FKDNX)
Price-to-Book Ratio: 6.08
Expense Ratio: 0.90%
Total Assets (millions): $3,700

12. Fidelity Select IT Services (FBSOX)
Price-to-Book Ratio: 6.09
Expense Ratio: 0.79%
Total Assets (millions): $1,700

11. Fidelity Select Leisure (FDLSX)
Price-to-Book Ratio: 6.11
Expense Ratio: 0.79%
Total Assets (millions): $563
10. GAMCO Growth AAA (GABGX)
Price-to-Book Ratio: 6.17
Expense Ratio: 1.33%
Total Assets (millions): $552
9. Marsico Focus (MFOCX)
Price-to-Book Ratio: 6.42
Expense Ratio: 1.29%
Total Assets (millions): $534
8. AB Large Cap Growth (APGAX)
Price-to-Book Ratio: 6.43
Expense Ratio: 1.16%
Total Assets (millions): $4,800
7. Columbia Select Large Cap Growth (UMLGX)
Price-to-Book Ratio: 6.51
Expense Ratio: 0.83%
Total Assets (millions): $4,200
6. Nuveen High Yield Municipal Bond (NHMRX)
Price-to-Book Ratio: 6.69
Expense Ratio: 0.52%
Total Assets (millions): $14,700

5. AB Growth (AGBBX)
Price-to-Book Ratio: 6.77
Expense Ratio: 2.08%
Total Assets (millions): $749

4. Nuveen CA High Yield Municipal Bond (NCHRX)
Price-to-Book Ratio: 6.897
Expense Ratio: 0.64%
Total Assets (millions): $861

4. Nuveen Short Duration Hi Yld Muni Bd (NVHIX)
Price-to-Book Ratio: 6.897
Expense Ratio: 0.54%
Total Assets (millions): $3,500

3. Touchstone Sands Capital Select Growth (PTSGX)
Price-to-Book Ratio: 7.13
Expense Ratio: 1.04%
Total Assets (millions): $2,400
2. Fidelity Select Retailing (FSRPX)
Price-to-Book Ratio: 8.45
Expense Ratio: 0.78%
Total Assets (millions): $1,900

1. Transamerica Capital Growth (IALAX)
Price-to-Book Ratio: 9.40
Expense Ratio: 1.22%
Total Assets (millions): $753


