If your clients are worried about high elevations and want to focus on value, where are the lowest P/E ratios? To find out, we collected all equity mutual funds and ETFs with more than $500 million in assets and ranked them by P/E ratios. Here we list the funds with the lowest 20.
Dominant on this list are emerging markets funds, value funds and, to a lesser extent, small-cap funds.
Emerging markets often command lower multiples than investments in the U.S. because of their more volatile economies and markets, says Sam Stovall, chief investment strategist of CFRA, an investment research firm. And value funds, by definition, buy shares that carry low prices relative to their underlying fundamentals, says Greg McBride, chief financial analyst of Bankrate. Small-caps are often volatile as well, he adds.
While low P/E ratios are one indication of the potential value of investments, portfolio managers often point out that share prices sometimes decline and never come back.
Scroll through to see the 20 mutual funds with the lowest P/E ratios, as well as their five-year returns and expense ratios. All data from Morningstar.

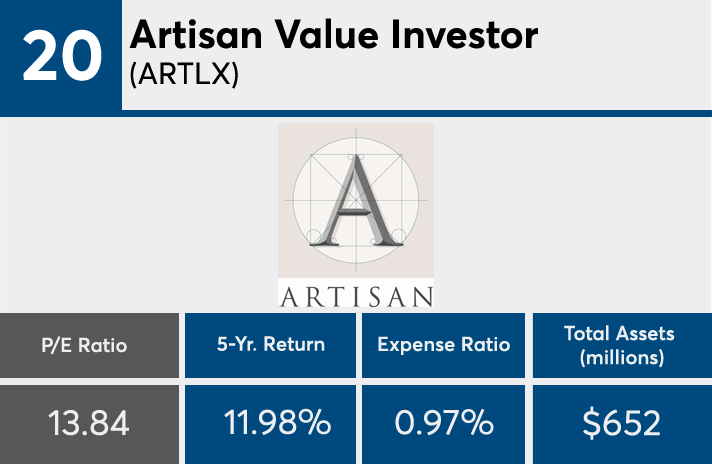
20. Artisan Value Investor (ARTLX)
5-Yr. Return: 11.98%
Expense Ratio: 0.97%
Net Assets (millions): $652

19. USAA Emerging Markets (USEMX)
5-Yr. Return: 4.00%
Expense Ratio: 1.51%
Net Assets (millions): $1,074

18. Domini Impact International Equity (DOMIX)
5-Yr. Return: 10.94%
Expense Ratio: 1.46%
Net Assets (millions): $1,196

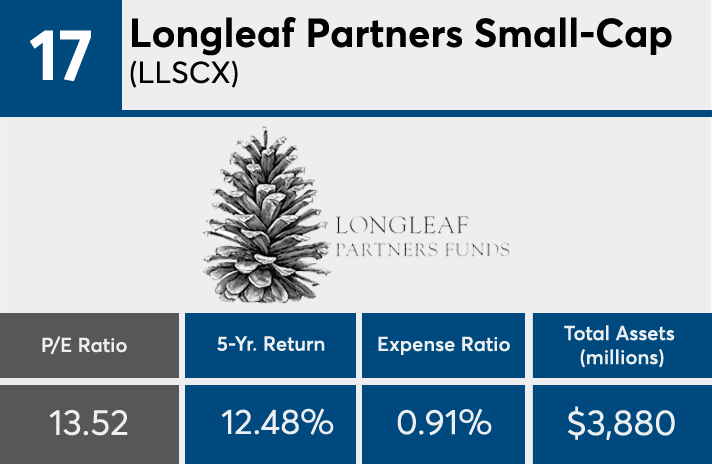
17. Longleaf Partners Small-Cap (LLSCX)
5-Yr. Return: 12.48%
Expense Ratio: 0.91%
Net Assets (millions): $3,880

16. Prudential QMA Mid-Cap Value (NCBVX)
5-Yr. Return: 13.03%
Expense Ratio: 1.95%
Net Assets (millions): $932

15. AB Emerging Markets (SNEMX)
5-Yr. Return: 5.64%
Expense Ratio: 1.50%
Net Assets (millions): $1,361

14. Fidelity Telecom and Utilities (FIUIX)
5-Yr. Return: 10.57%
Expense Ratio: 0.57%
Net Assets (millions): $997

13. Lord Abbett Intl Dividend Inc (LIDFX)
5-Yr. Return: 4.97%
Expense Ratio: 0.91%
Net Assets (millions): $1,053

12. GMO International Equity III (GMOIX)
5-Yr. Return: 7.89%
Expense Ratio: 0.65%
Net Assets (millions): $5,496

11. Hartford Schroders Intl Multi-Cp Val (SIDNX)
5-Yr. Return: 8.35%
Expense Ratio: 0.89%
Net Assets (millions): $1,381

10. GMO Emerging Markets III (GMOEX)
5-Yr. Return: 3.21%
Expense Ratio: 0.94%
Net Assets (millions): $5,272

9. Russell Inv Emerging Markets (REMSX)
5-Yr. Return: 4.89%
Expense Ratio: 1.47%
Net Assets (millions): $2,546

8. SEI Emerging Markets Equity (SMQFX)
5-Yr. Return: N/A
Expense Ratio: 0.67%
Net Assets (millions): $1,254

7. Wells Fargo International Value (WFFAX)
5-Yr. Return: 7.45%
Expense Ratio: 1.35%
Net Assets (millions): $788

6. VALIC Company I Emerg Economies (VCGEX)
5-Yr. Return: 5.34%
Expense Ratio: 0.94%
Net Assets (millions): $798

5. Brandes International Small Cap Equity (BISAX)
5-Yr. Return: 10.72%
Expense Ratio: 1.32%
Net Assets (millions): $1,787

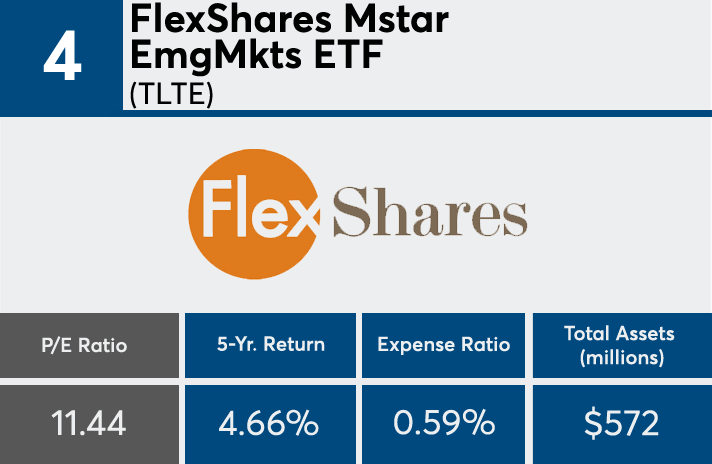
4. FlexShares Mstar EmgMkts ETF (TLTE)
5-Yr. Return: 4.66%
Expense Ratio: 0.59%
Net Assets (millions): $572

3. JPMorgan Emerging Economies R5 (JEERX)
5-Yr. Return: 4.26%
Expense Ratio: 0.79%
Net Assets (millions): $2,066

2. Fidelity Select Utilities (FSUTX)
5-Yr. Return: 12.38%
Expense Ratio: 0.79%
Net Assets (millions): $738

1. Heartland Value Investor (HRTVX)
5-Yr. Return: 9.18%
Expense Ratio: 1.09%
Net Assets (millions): $815


