
Standard deviation is one such gauge, which we
We looked at funds that had at least $100 million in assets, and a one-year return of at least 8%. That’s less than the S&P 500, of course, but managing for volatility entails a willingness to accept less on the upside to guard against the downside. Scroll through to see the funds that meet those two requirements, ranked by the smallest beta scores.
All data from Morningstar.
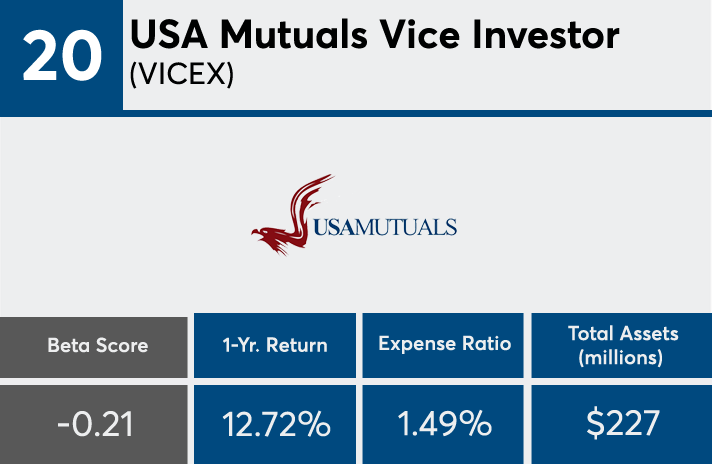
20. USA Mutuals Vice Investor (VICEX)
1-Yr. Returns: 12.72%
Expense Ratio: 1.49%
Total Assets (millions): $227
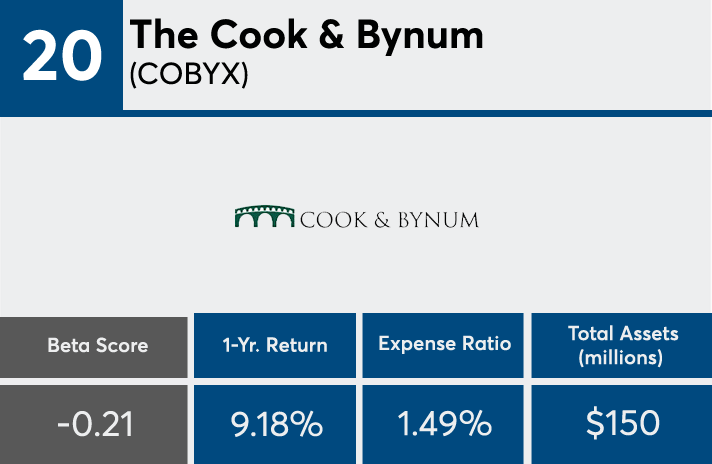
20. The Cook & Bynum (COBYX)
1-Yr. Returns: 9.18%
Expense Ratio: 1.49%
Total Assets (millions): $150
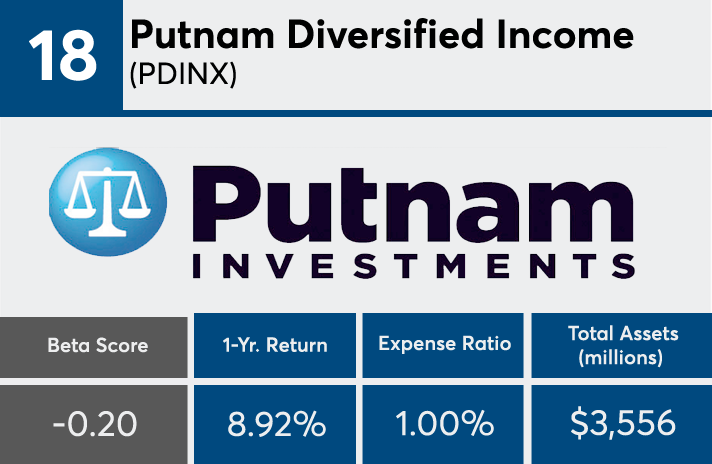
18. Putnam Diversified Income (PDINX)
1-Yr. Returns: 8.92%
Expense Ratio: 1.00%
Total Assets (millions): $3,556
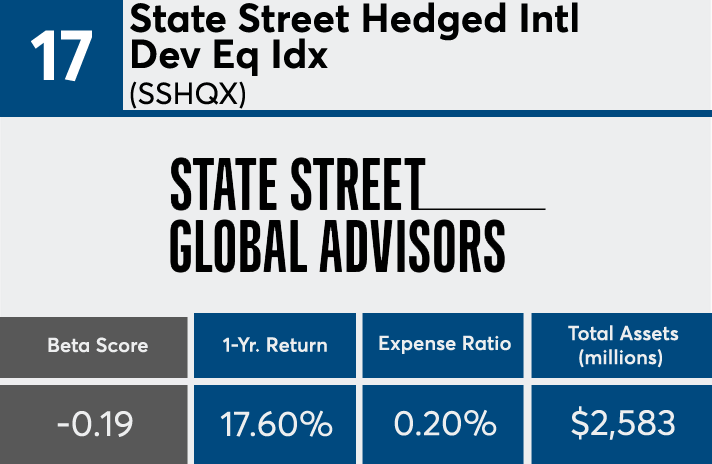
17. State Street Hedged Intl Dev Eq Idx (SSHQX)
1-Yr. Returns: 17.60%
Expense Ratio: 0.20%
Total Assets (millions): $2,583
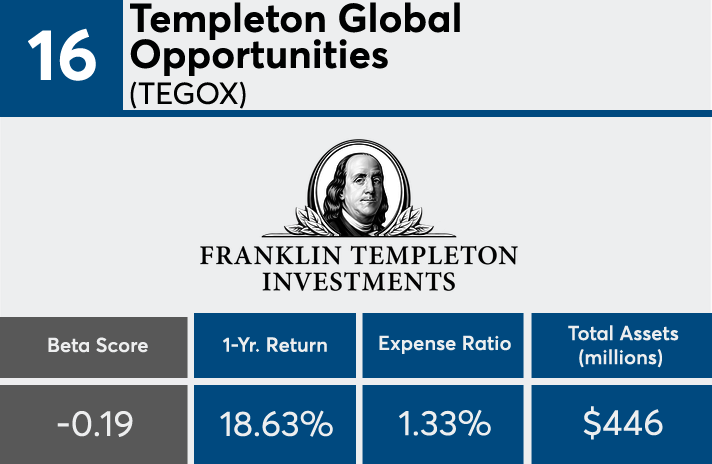
16. Templeton Global Opportunities (TEGOX)
1-Yr. Returns: 18.63%
Expense Ratio: 1.33%
Total Assets (millions): $446
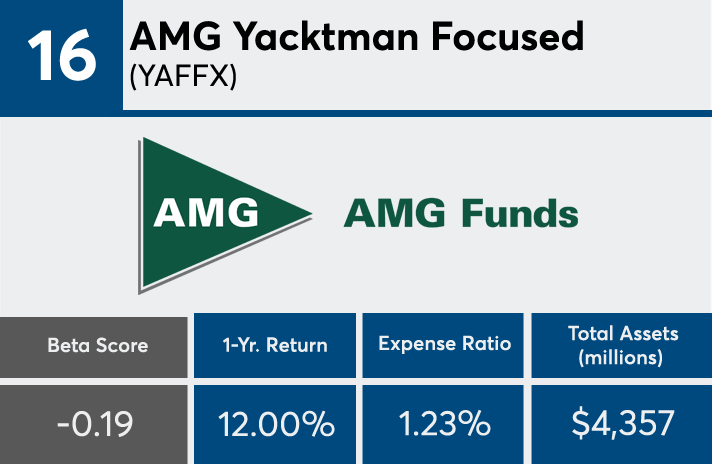
16. AMG Yacktman Focused (YAFFX)
1-Yr. Returns: 12.00%
Expense Ratio: 1.23%
Total Assets (millions): $4,357
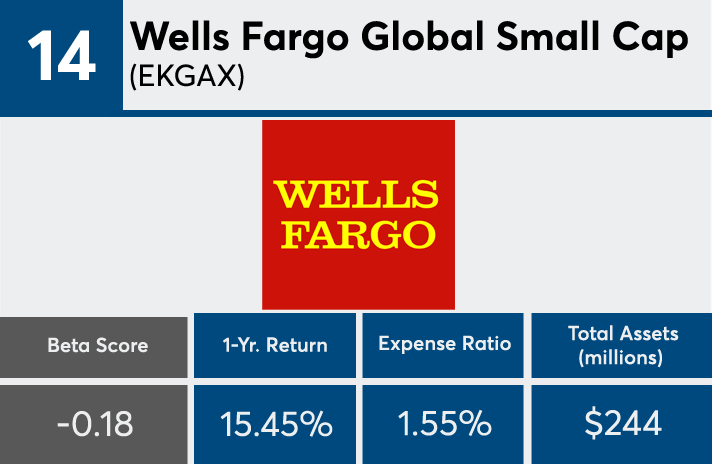
14. Wells Fargo Global Small Cap (EKGAX)
1-Yr. Returns: 15.45%
Expense Ratio: 1.55%
Total Assets (millions): $244
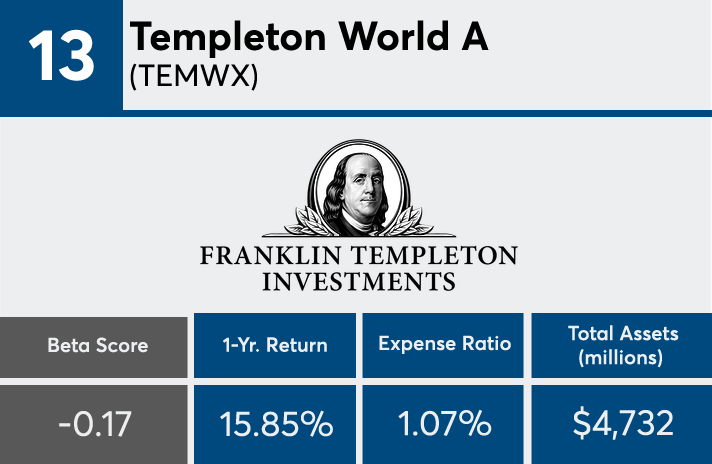
13. Templeton World A (TEMWX)
1-Yr. Returns: 15.85%
Expense Ratio: 1.07%
Total Assets (millions): $4,732
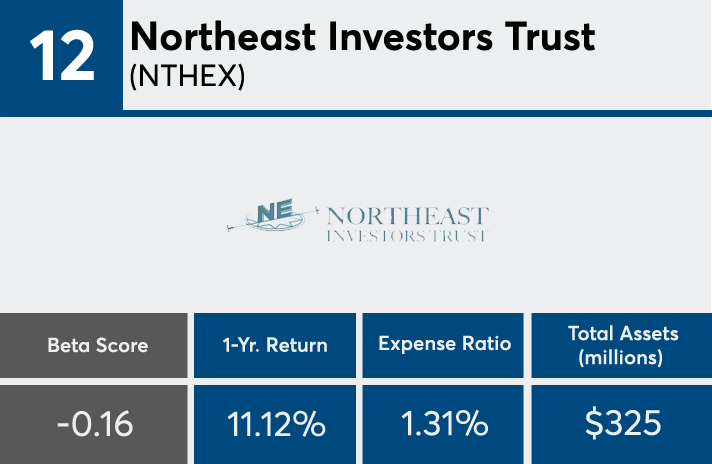
12. Northeast Investors Trust (NTHEX)
1-Yr. Returns: 11.12%
Expense Ratio: 1.31%
Total Assets (millions): $325
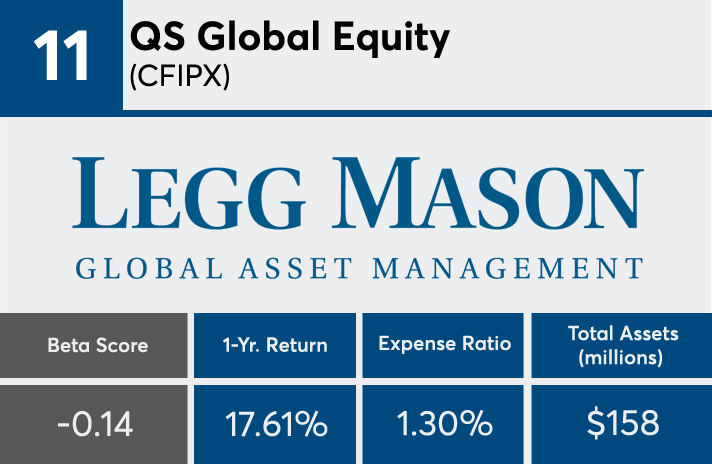
11. QS Global Equity (CFIPX)
1-Yr. Returns: 17.61%
Expense Ratio: 1.30%
Total Assets (millions): $158
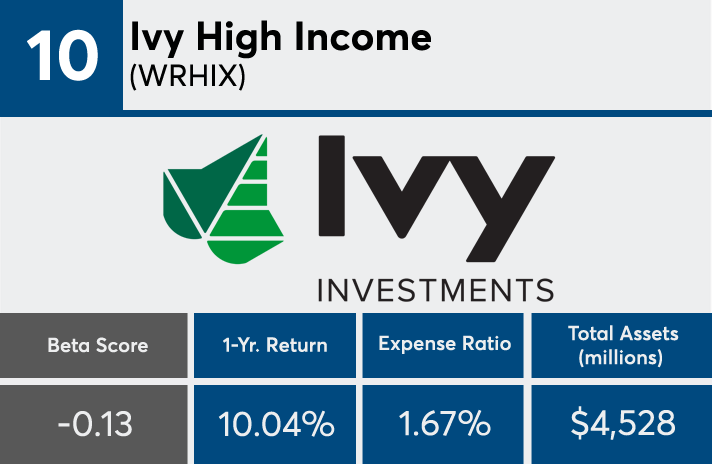
10. Ivy High Income (WRHIX)
1-Yr. Returns: 10.04%
Expense Ratio: 1.67%
Total Assets (millions): $4,528
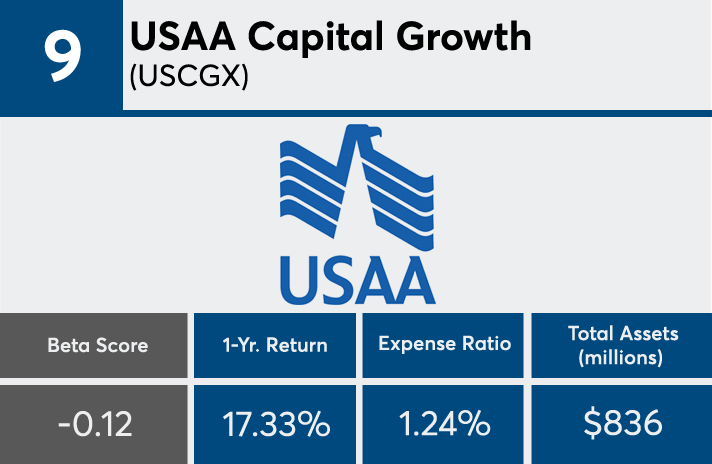
9. USAA Capital Growth (USCGX)
1-Yr. Returns: 17.33%
Expense Ratio: 1.24%
Total Assets (millions): $836
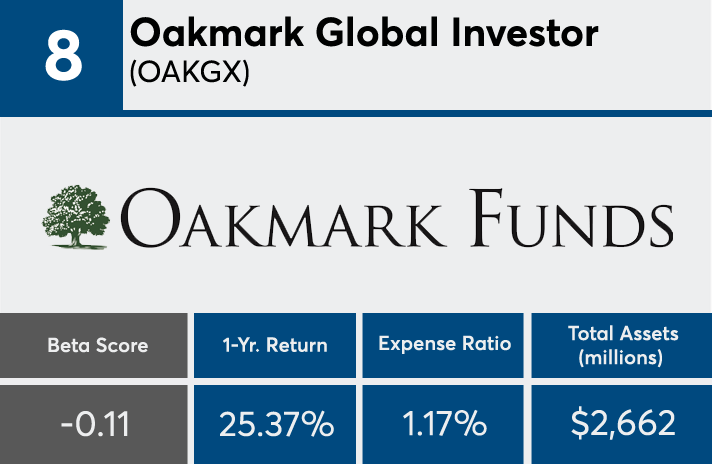
8. Oakmark Global Investor (OAKGX)
1-Yr. Returns: 25.37%
Expense Ratio: 1.17%
Total Assets (millions): $2,662
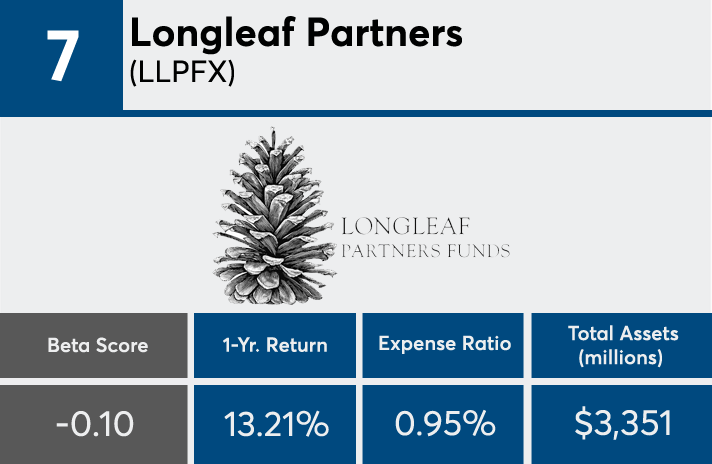
7. Longleaf Partners (LLPFX)
1-Yr. Returns: 13.21%
Expense Ratio: 0.95%
Total Assets (millions): $3,351
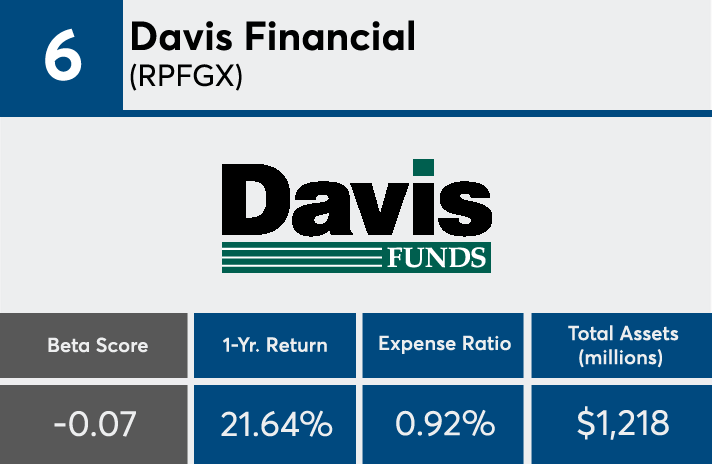
6. Davis Financial (RPFGX)
1-Yr. Returns: 21.64%
Expense Ratio: 0.92%
Total Assets (millions): $1,218
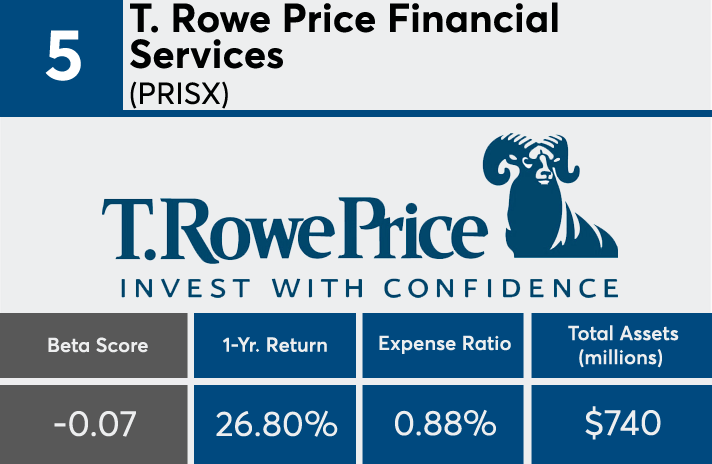
5. T. Rowe Price Financial Services (PRISX)
1-Yr. Returns: 26.80%
Expense Ratio: 0.88%
Total Assets (millions): $740

4. Gabelli Focus Five (GWSAX)
1-Yr. Returns: 8.90%
Expense Ratio: 1.42%
Total Assets (millions): $160
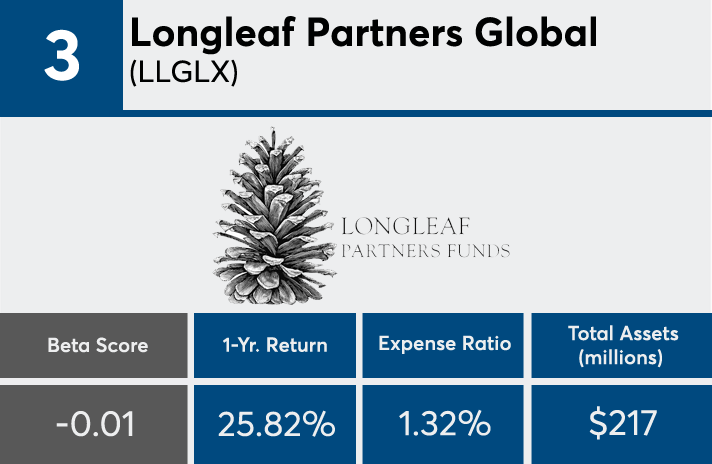
3. Longleaf Partners Global (LLGLX)
1-Yr. Returns: 25.82%
Expense Ratio: 1.32%
Total Assets (millions): $217
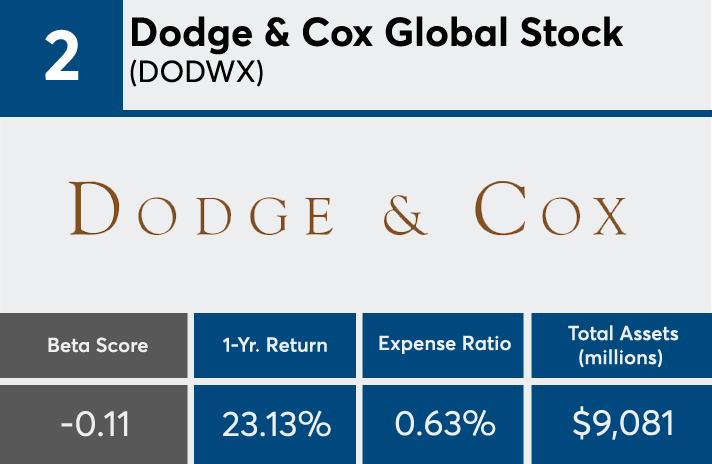
2. Dodge & Cox Global Stock (DODWX)
1-Yr. Returns: 23.13%
Expense Ratio: 0.63%
Total Assets (millions): $9,081
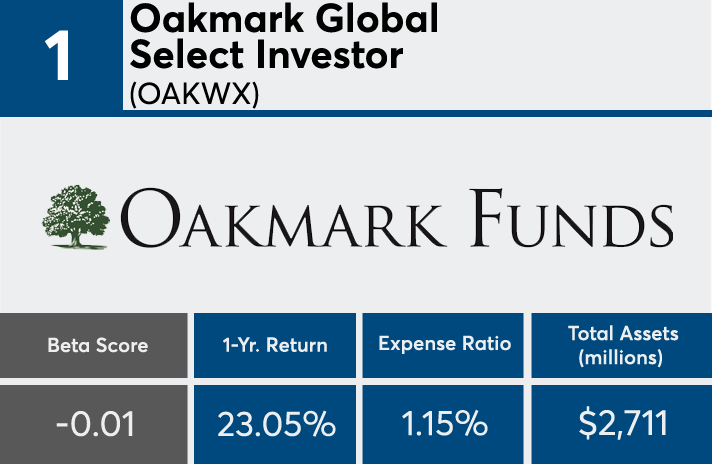
1. Oakmark Global Select Investor (OAKWX)
1-Yr. Returns: 23.05%
Expense Ratio: 1.15%
Total Assets (millions): $2,711


