Bear funds also fell off a cliff in 2016. As a group, they were down more than 4% in 2015, but year-to-date in 2016, they've decline another 20%, not that surprising in a year when the S&P 500 posted gains of more than 10%. (This was originally posted in mid December.)
The bottom half of the list of declines was dominated by munis. New York and California each accounted for two categories, but Massachusetts, Pennsylvania and Ohio were also present and accounted for, as well as high yield munis.
To be sure, the first half the year was good for munis, but in the fall, worries of rate hikes loomed large and slowed gains. Then, Trump's surprise victory in November created uncertainty for fixed-income (although gave a boost for stocks) as expectations for more government spending has brought worries of higher inflation.
Scroll through to see the biggest declines, by category, in the markets. Declines were measured by the largest percentage point decrease in 2016 year-to-date performance over 2015 performance. Only categories with at least 10 funds were included. All data is from Morningstar.

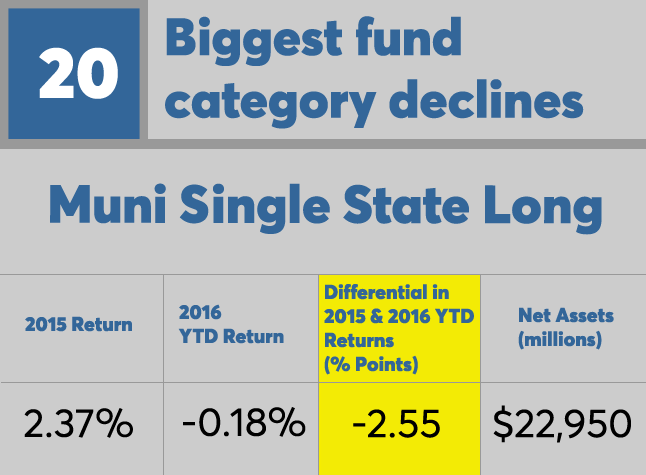
20. Muni Single State Long
2016 YTD Return: -0.18%
Differential in 2015 & 2016 YTD Returns (% Points): -2.55
Net Assets (millions): $22,950

19. Foreign Small/Mid Blend
2016 YTD Return: 0.80%
Differential in 2015 & 2016 YTD Returns (% Points): -2.85
Net Assets (millions): $19,069

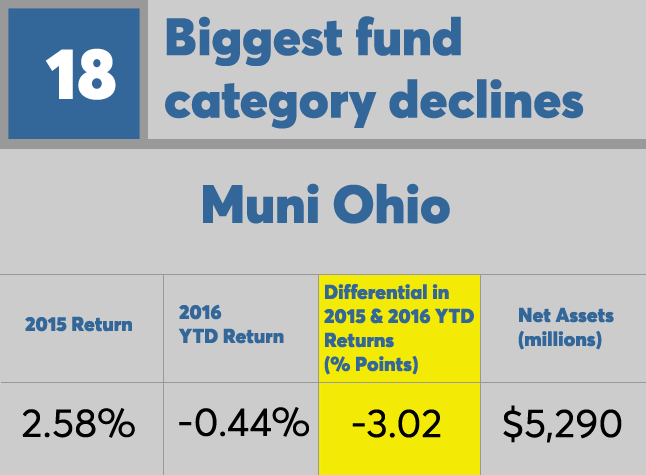
18. Muni Ohio
2016 YTD Return: -0.44%
Differential in 2015 & 2016 YTD Returns (% Points): -3.02
Net Assets (millions): $5,290

17. Muni Single State Interm
2016 YTD Return: -0.93%
Differential in 2015 & 2016 YTD Returns (% Points): -3.26
Net Assets (millions): $13,306

16. Muni Pennsylvania
2016 YTD Return: -0.35%
Differential in 2015 & 2016 YTD Returns (% Points): -3.35
Net Assets (millions): $9,581

15. Muni National Interm
2016 YTD Return: -0.89%
Differential in 2015 & 2016 YTD Returns (% Points): -3.39
Net Assets (millions): $183,490

14. Muni New York Long
2016 YTD Return: -0.30%
Differential in 2015 & 2016 YTD Returns (% Points): -3.41
Net Assets (millions): $19,656

13. Muni Massachusetts
2016 YTD Return: -0.87%
Differential in 2015 & 2016 YTD Returns (% Points): -3.50
Net Assets (millions): $7,386

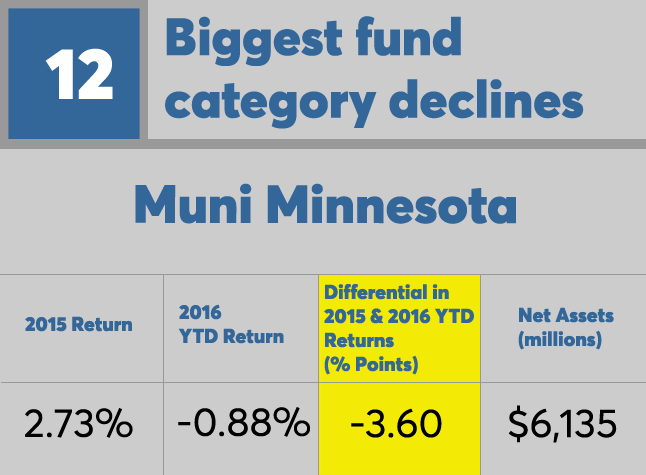
12. Muni Minnesota
2016 YTD Return: -0.88%
Differential in 2015 & 2016 YTD Returns (% Points): -3.60
Net Assets (millions): $6,135

11. Muni New York Intermediate
2016 YTD Return: -1.06%
Differential in 2015 & 2016 YTD Returns (% Points): -3.84
Net Assets (millions): $10,834

10. Muni National Long
2016 YTD Return: -0.83%
Differential in 2015 & 2016 YTD Returns (% Points): -3.92
Net Assets (millions): $88,677

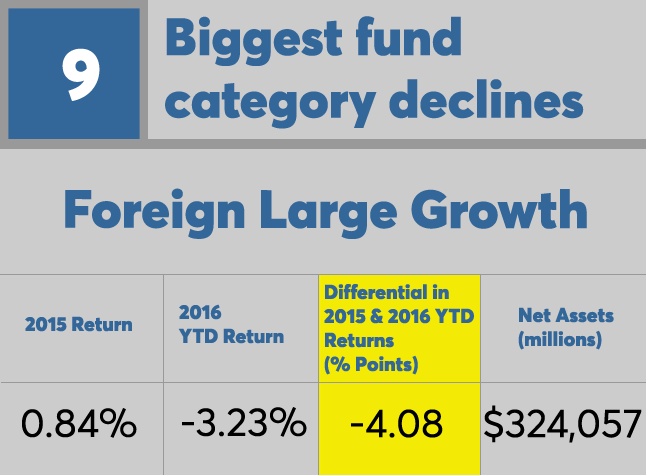
9. Foreign Large Growth
2016 YTD Return: -3.23%
Differential in 2015 & 2016 YTD Returns (% Points): -4.08
Net Assets (millions): $324,057

8. High Yield Muni
2016 YTD Return: 0%
Differential in 2015 & 2016 YTD Returns (% Points): -4.19
Net Assets (millions): $90,369

7. Muni California Intermediate
2016 YTD Return: -1.38%
Differential in 2015 & 2016 YTD Returns (% Points): -4.27
Net Assets (millions): $25,660

6. Muni California Long
2016 YTD Return: -0.91%
Differential in 2015 & 2016 YTD Returns (% Points): -4.68
Net Assets (millions): $38,683

5. Europe Stock
2016 YTD Return: -5.27%
Differential in 2015 & 2016 YTD Returns (% Points): -7.05
Net Assets (millions): $18,047

4. Japan Stock
2016 YTD Return: 2.24%
Differential in 2015 & 2016 YTD Returns (% Points): -10.04
Net Assets (millions): $7,081

3. Foreign Small/Mid Growth
2016 YTD Return: -3.89%
Differential in 2015 & 2016 YTD Returns (% Points): -11.35
Net Assets (millions): $35,914

2. Bear Market
2016 YTD Return: -20.37%
Differential in 2015 & 2016 YTD Returns (% Points): -15.59
Net Assets (millions): $3,214

1. Health
2016 YTD Return: -10.06%
Differential in 2015 & 2016 YTD Returns (% Points): -18.21
Net Assets (millions): $103,228


