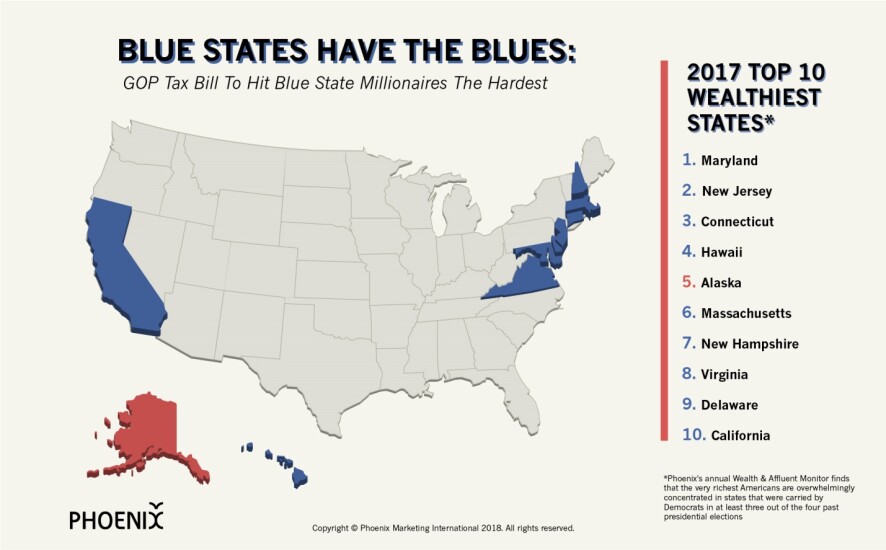
Advisors should take note, as the new tax law may complicate planning for high-net-worth clients in the wealthier states. Most of the wealth is concentrated on the East Coast: Maryland boasts the highest ratio of millionaires per capita for the seventh year in a row at 7.87%. Additionally, New Jersey, Connecticut, Massachusetts, New Hampshire, Virginia and Delaware all rank in the top 10 states.
Coming in at 15th on the list, Wyoming saw the largest percent change of millionaires from 2016 at 5%. Oregon, Georgia, Nevada, Indiana, Oklahoma and New Mexico all saw increases of 2%.
Growth was also strong in ultrahigh-net-worth households. The number of penta millionaires, or households with over $5 million in assets, grew eight percentage points to its highest number in 30 years.
There was also growth in affluent household wealth, or those with $250,000 or more in investable assets. Households in the near-affluent segment, with $100k-$249k, didn’t fare quite as well in 2017, losing $116 billion worth of wealth or 4%.
The report also noted that most millionaires live in states that were blue during the 2016 presidential election.
“The perception is that Republicans are wealthier overall or that wealthy people tend to vote republican,” says David Thompson, the study's lead researcher. When they mapped the top states in red or blue, they found that clusters of red states didn’t appear until lower on the list, Thompson says.
Regardless of their clients' political affiliation, advisors should be aware of how clients in the top states will be impacted by the new tax law. Because the law puts limits on itemized deductions of state and local income and property taxes and mortgage interest, wealthy residents in the richer blue states are likely to be hit harder by its impact, according to the study. Some millionaires may want to rethink their residency or investment strategy; many will need guidance navigating new rules to see the best growth in assets.
The report uses a combination of sources to determine market size and segments, including the Survey of Consumer Finance (SCF) and Nielsen-Claritas. The last survey took place in 2016 and surveyed 6,500 families who volunteered to participate. Since 1992, data have been collected by the National Opinion Research Center at the University of Chicago.
Click through to see the top 10 states with the most millionaires per capita.

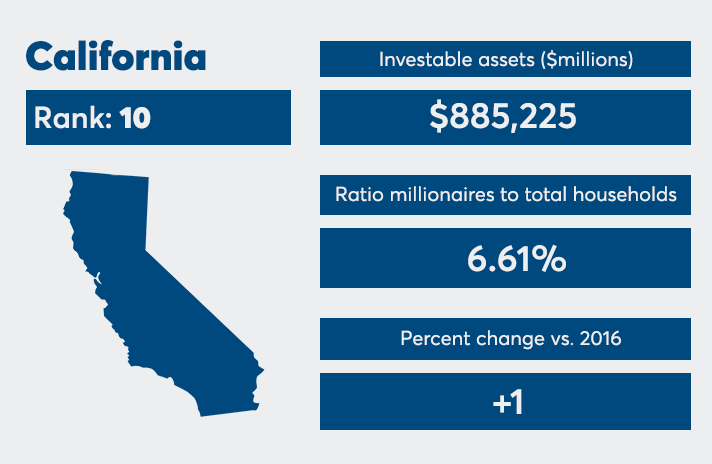
California
Ratio Millionaire to Total Households: 6.61%
Percent Change vs 2016: +1

Delaware
Ratio Millionaire to Total Households: 6.62%
Percent Change vs 2016: +1

Virginia
Ratio Millionaire to Total Households: 6.98%
Percent Change vs 2016: none

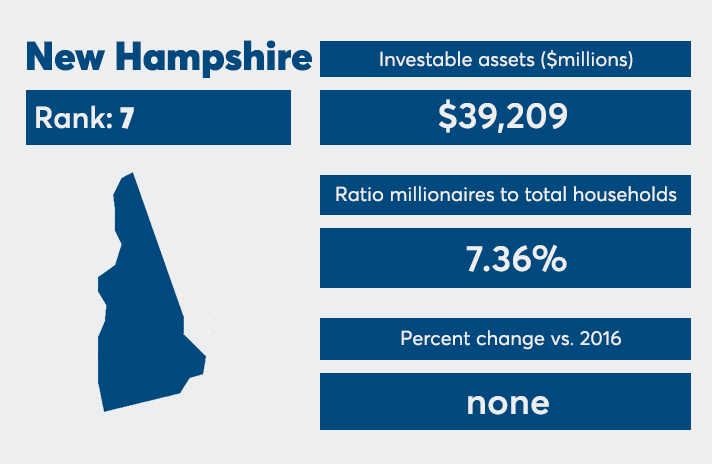
New Hampshire
Ratio Millionaire to Total Households: 7.36%
Percent Change vs 2016: none

Massachusetts
Ratio Millionaire to Total Households: 7.41%
Percent Change vs 2016: none

Alaska
Ratio Millionaire to Total Households: 7.50%
Percent Change vs 2016: none

Hawaii
Ratio Millionaire to Total Households: 7.57%
Percent Change vs 2016: none

Connecticut
Ratio Millionaire to Total Households: 7.75%
Percent Change vs 2016: -1

New Jersey
Ratio Millionaire to Total Households: 7.86%
Percent Change vs 2016: +1

Maryland
Ratio Millionaire to Total Households: 7.87%
Percent Change vs 2016: none


