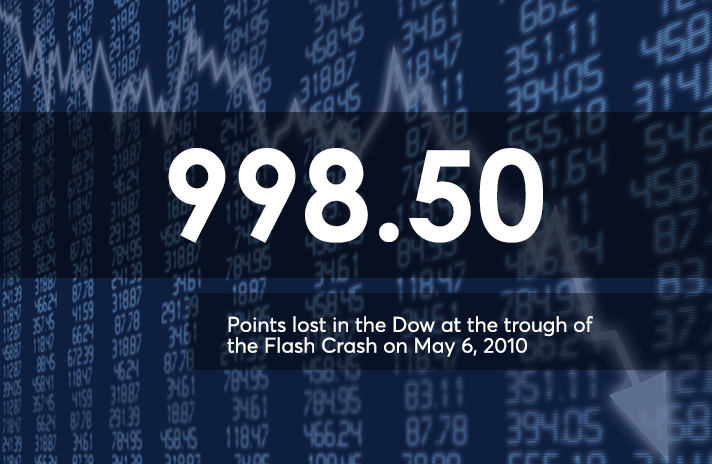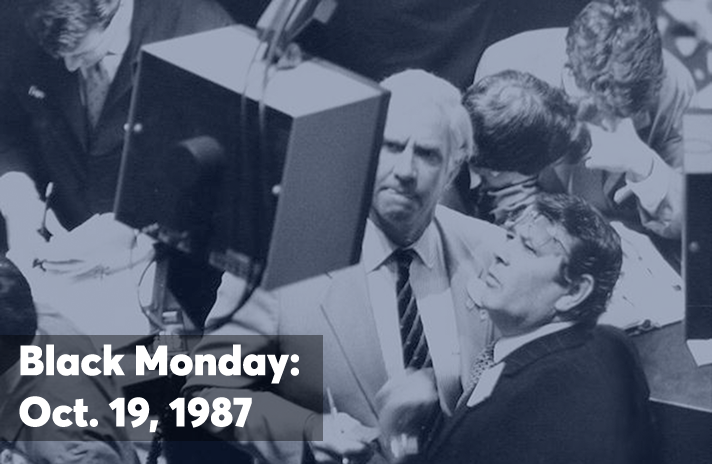
The crash of 1987, by the numbers
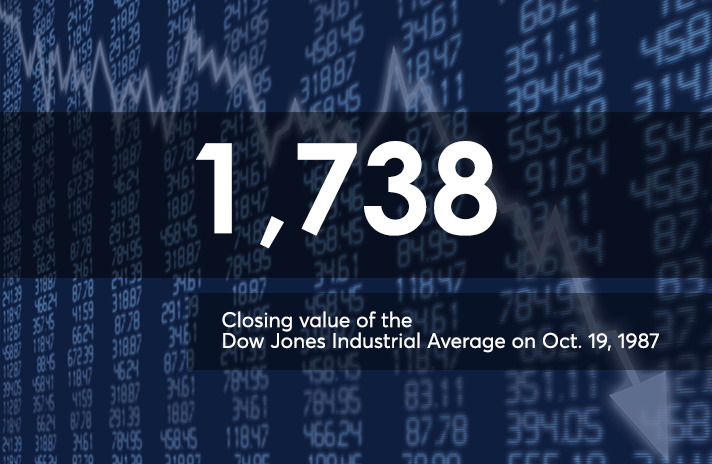
For context, that same point drop in the Dow today would be just a 2.2% decline, which would still get many clients anxious in today’s hyper 24-hour news cycle, but certainly would not be remembered 30 years later as a memorable moment in financial history.
However, a 22.6% Dow drop based on Tuesday's close would amount to a loss of 5,233 points — which surely would be regarded as a global crisis of historic proportions.
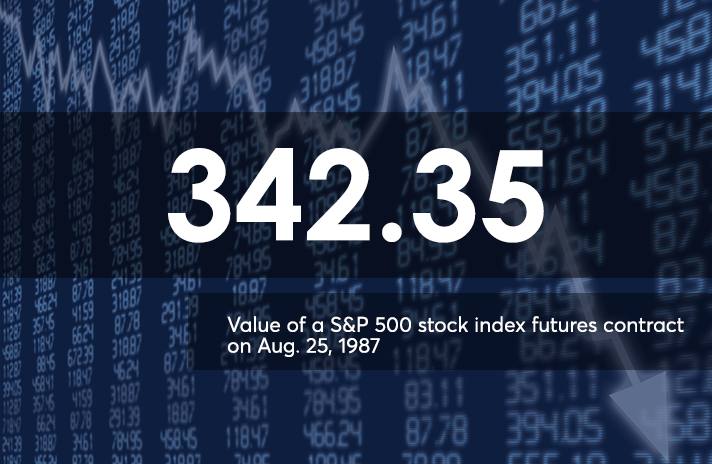
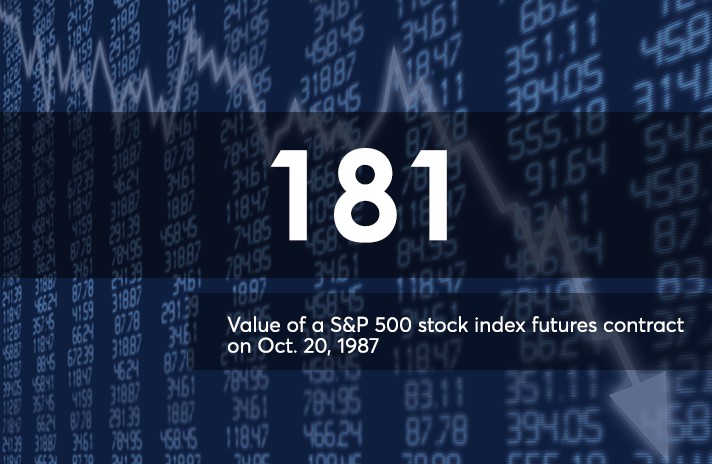
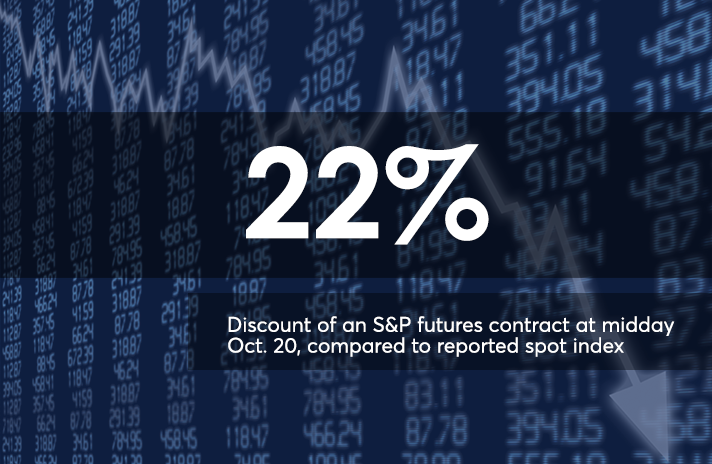
There has never been one agreed-upon cause as to what caused Black Monday. Commonly cited reasons include overwhelmed computer trading and stock index futures, which were relatively new at the time. When stock prices began to plummet, which actually began the previous week, it triggered more selling in portfolio insurance models.
Panic also played a part, of course. This is where advisors can help clients stick to their portfolio allocations and not blindly sell — making paper losses permanent — despite fearful headlines.
Moreover, technology has advanced tremendously since 1987. Most fintech executives say there are enough barriers to prevent a run on the markets of that magnitude, despite recent flash crashes triggered by algorithmic traders. They go on to say they doubt if robo advisors would have had much impact had they existed then; they suggest that having emotionless trading controls could have avoided some of the sell-off.
As bad as the pain was that fateful day in 1987, it was relatively short-lived. In two years, the Dow was back to precrash levels. Yet it took the average 25 years to erase the losses after the 1929 crash.
Click through the images above to see Black Monday by the numbers, on its 30th anniversary.
Image: Photo by Mel Finkelstein/NY Daily News Archive
Data: Jeremy J. Siegel, Wharton School; Points and Figures; SIFMA

