
By company, iShares was the biggest winner in YTD flows, with 11 of the top 20. As for type of fund, it ran the gamut: S&P 500, small cap, emerging markets and fixed income.
Consider the overall total for another moment. If $94 billion were a company’s annual revenue, it would rank #23 on the newly released Fortune 500 – more than Citigroup, Wells Fargo or Bank of America.
Scroll through to see the latest 20 inflows year to date. All data from Morningstar.

20. iShares Core S&P Total US Stock Mkt (ITOT)
3-Yr. Return: 10.33%
Expense Ratio: 0.03%
Total Assets (millions): $8,929

19. DFA Emerging Markets Core Equity I (DFCEX)
3-Yr. Return: 2.48%
Expense Ratio: 0.53%
Total Assets (millions): $23,498
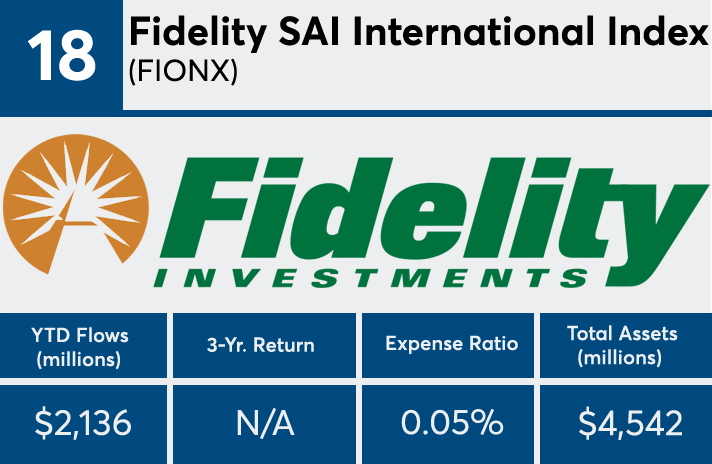
18. Fidelity SAI International Index (FIONX)
3-Yr. Return: N/A
Expense Ratio: 0.05%
Total Assets (millions): $4,542
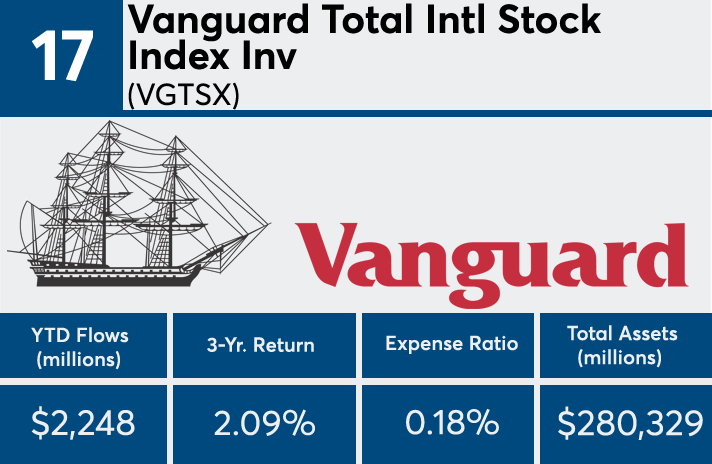
17. Vanguard Total Intl Stock Index Inv (VGTSX)
3-Yr. Return: 2.09%
Expense Ratio: 0.18%
Total Assets (millions): $280,329

16. Bridge Builder Core Bond (BBTBX)
3-Yr. Return: 3.15%
Expense Ratio: 0.17%
Total Assets (millions): $13,509

15. Strategic Advisers Core Income (FPCIX)
3-Yr. Return: 3.06%
Expense Ratio: 0.45%
Total Assets (millions): $32,455

14. BlackRock S&P 500 Index K (WFSPX)
3-Yr. Return: 10.48%
Expense Ratio: 0.04%
Total Assets (millions): $11,325

13. iShares Core US Aggregate Bond (AGG)
3-Yr. Return: 2.68%
Expense Ratio: 0.05%
Total Assets (millions): $45,475

12. PowerShares QQQ ETF (QQQ)
3-Yr. Return: 17.54%
Expense Ratio: 0.20%
Total Assets (millions): $52,743

11. iShares JPMorgan USD Emerg Markets Bond (EMB)
3-Yr. Return: 4.99%
Expense Ratio: 0.40%
Total Assets (millions): $11,847
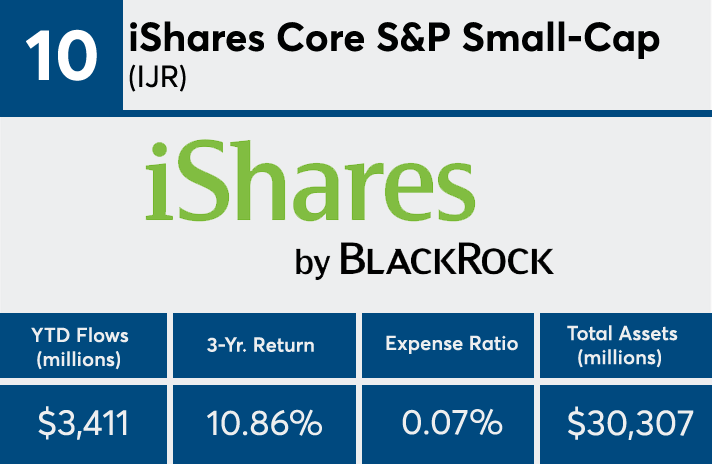
10. iShares Core S&P Small-Cap (IJR)
3-Yr. Return: 10.86%
Expense Ratio: 0.07%
Total Assets (millions): $30,307
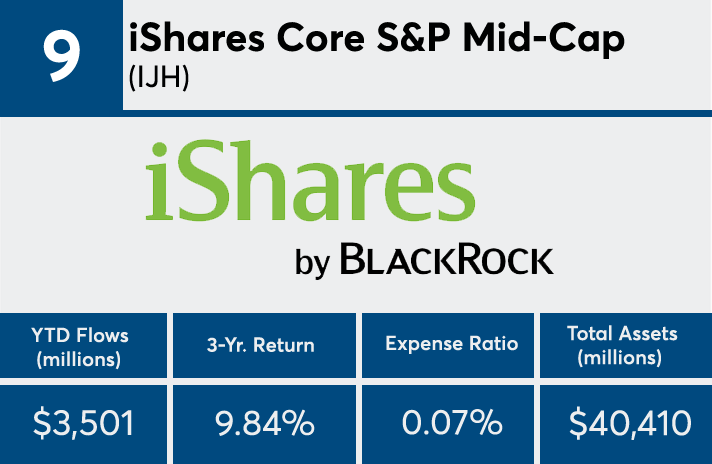
9. iShares Core S&P Mid-Cap (IJH)
3-Yr. Return: 9.84%
Expense Ratio: 0.07%
Total Assets (millions): $40,410
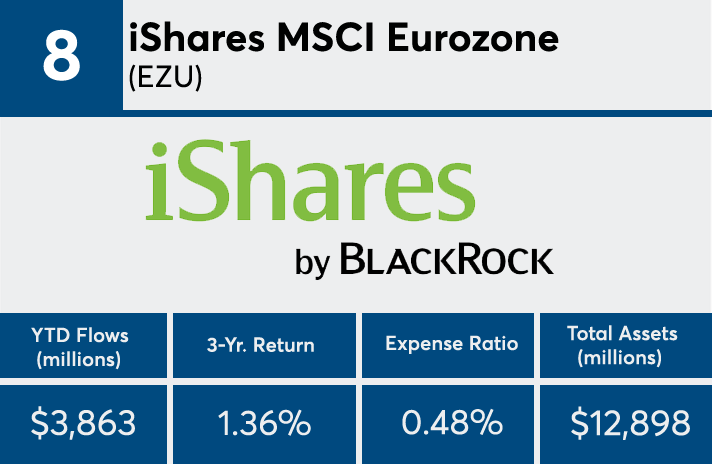
8. iShares MSCI Eurozone (EZU)
3-Yr. Return: 1.36%
Expense Ratio: 0.48%
Total Assets (millions): $12,898

7. Vanguard Total Stock Mkt Idx Inv (VTSMX)
3-Yr. Return: 9.97%
Expense Ratio: 0.15%
Total Assets (millions): $574,642

6. iShares iBoxx $ Invst Grade Crp Bond (LQD)
3-Yr. Return: 3.92%
Expense Ratio: 0.15%
Total Assets (millions): $34,517
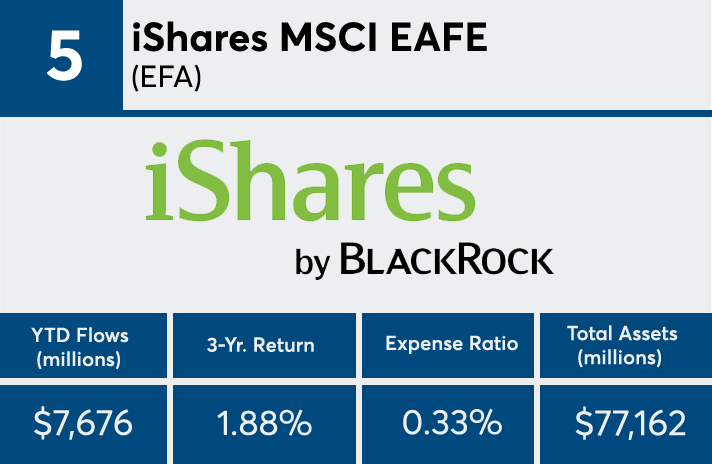
5. iShares MSCI EAFE (EFA)
3-Yr. Return: 1.88%
Expense Ratio: 0.33%
Total Assets (millions): $77,162

4. Vanguard Total Bond Market II Idx Inv (VTBIX)
3-Yr. Return: 2.56%
Expense Ratio: 0.09%
Total Assets (millions): $129,823
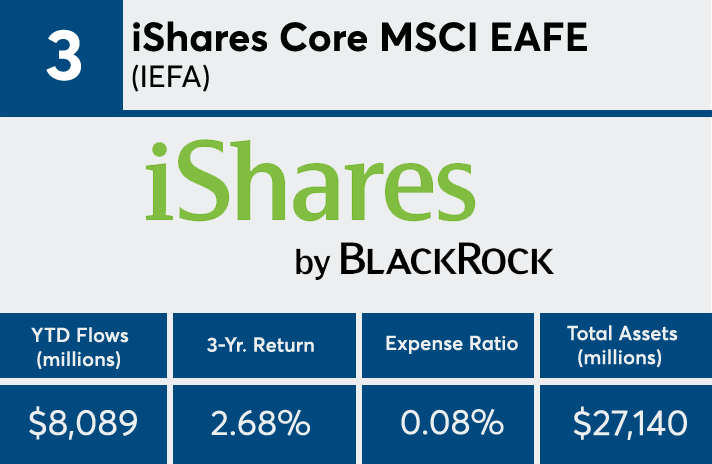
3. iShares Core MSCI EAFE (IEFA)
3-Yr. Return: 2.68%
Expense Ratio: 0.08%
Total Assets (millions): $27,140

2. iShares Core MSCI Emerging Markets (IEMG)
3-Yr. Return: 1.89%
Expense Ratio: 0.14%
Total Assets (millions): $31,555

1. iShares Core S&P 500 (IVV)
3-Yr. Return: 10.47%
Expense Ratio: 0.04%
Total Assets (millions): $113,870


