
Indeed, the S&P 500 has posted annualized gains of 9.4% over the past 10 years, as measured by the SPDR ETF. The total U.S. market has been slightly better, at 9.7%, as measured by Vanguard’s Total U.S market fund. And the disciplined advisors who ploughed fresh money into stock funds at the painful bottom in March 2009 – the Dow was at 6,500, the Nasdaq at 1,268 and the S&P 500 at 676, just 25% of present levels – could have notched annualized gains closer to 15% on those investments.
Since 2009, the S&P 500 has posted nine positive years in a row, and all but two were double-digit gains.
This bull market has been marked by very strong performance among growth stocks — technology and biotech in particular —says Christine Benz, director of personal finance at Morningstar. Indeed, over this past decade, the Vanguard Growth Index has gained two full percentage points more per year on an annualized basis than Vanguard’s Value Index.
The sharp advance in equities has coincided with a period of strong growth for the economy, Benz says. But the stocks that have increased the most — such as Apple, Amazon, Netflix and Facebook —have grown much more rapidly than the broad market.
While quantitative easing from the Fed is an often-cited catalyst for this bull market, Tom Roseen, head of Research Services at Lipper, notes it should also be attributed to changes in innovation and entrepreneurship stemming from increases in technology. The rise of the “FANG stocks” — Facebook, Amazon, Netflix and Google — over the past decade show the impact new technology has had on the overall economy, he notes in an email message. Computing power, cell phone advances, 3D printing, medical and pharmaceutical advances and other innovative products have made life better, in most cases, and more productive, he says.
How does this bull market compare to others? Benz says it’s one of the longest in U.S. investing history, although there's a caveat. The S&P 500 actually dropped 22% from May to October 2011. Indeed, that year was one of the lowest annual returns since the crash, at 1.9%.
Scroll through to see the top-performing mutual funds over the past 10 years. We also show each fund’s one-year return, expense ratios and total assets. Highly leveraged funds, those with less than $500 million in assets, funds with investment minimums of more than $100,000 and institutional funds were excluded. All data from Morningstar Direct.
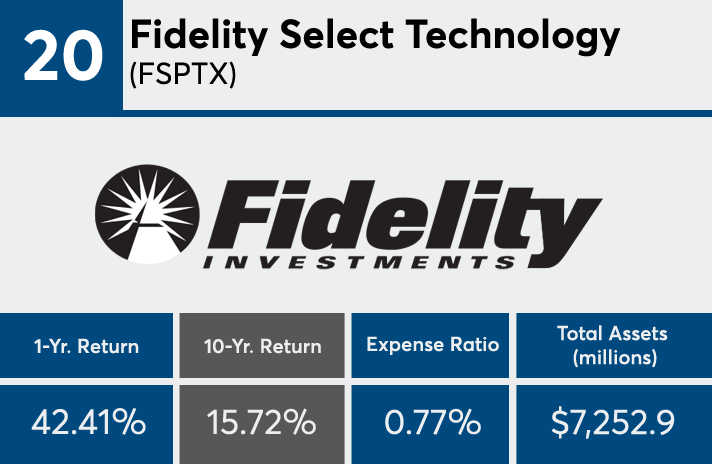
20. Fidelity Select Technology (FSPTX)
10-Yr. Return: 15.72%
Expense Ratio: 0.77%
Total Assets (millions): $7,252.9

19. First Trust NASDAQ-100-Tech Sector ETF (QTEC)
10-Yr. Return: 15.73%
Expense Ratio: 0.60%
Total Assets (millions): $2,320

18. Red Oak Technology Select (ROGSX)
10-Yr. Return: 15.84%
Expense Ratio: 1.09%
Total Assets (millions): $502

17. Fidelity Advisor Technology I (FATIX)
10-Yr. Return: 15.86%
Expense Ratio: 0.77%
Total Assets (millions): $1,985.9

16. iShares Nasdaq Biotechnology ETF (IBB)
10-Yr. Return: 15.89%
Expense Ratio: 0.47%
Total Assets (millions): $9,696.1

15. VALIC Company I Health Sciences (VCHSX)
10-Yr. Return: 16.05%
Expense Ratio: 1.07%
Total Assets (millions): $778.9
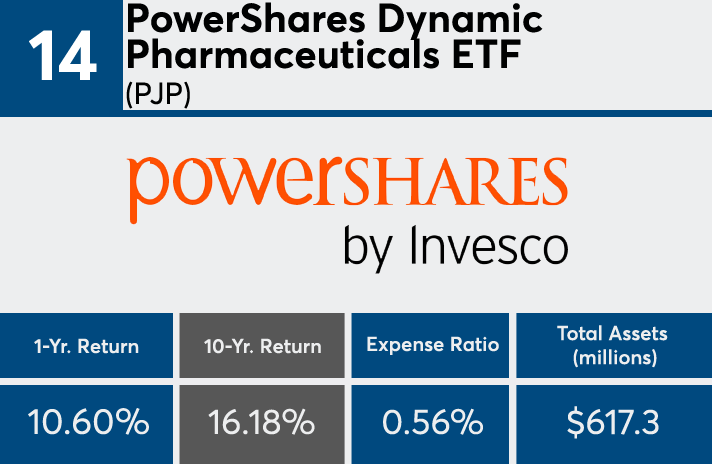
14. PowerShares Dynamic Pharmaceuticals ETF (PJP)
10-Yr. Return: 16.18%
Expense Ratio: 0.56%
Total Assets (millions): $617.27
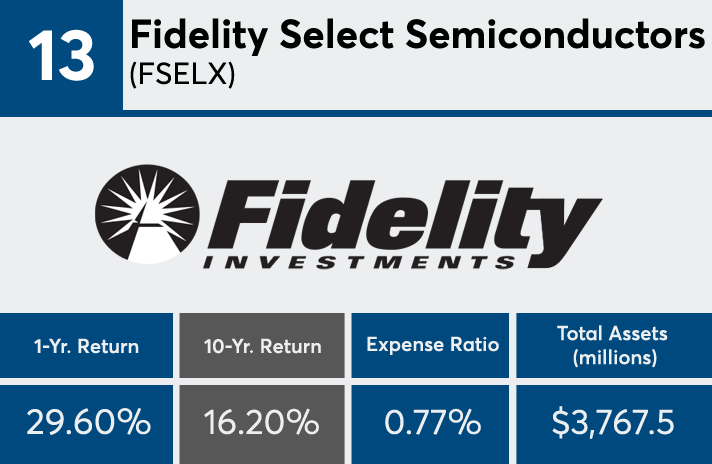
13. Fidelity Select Semiconductors (FSELX)
10-Yr. Return: 16.20%
Expense Ratio: 0.77%
Total Assets (millions): $3,767.5

12. T. Rowe Price Health Sciences (PRHSX)
10-Yr. Return: 16.51%
Expense Ratio: 0.77%
Total Assets (millions): $12,675.7
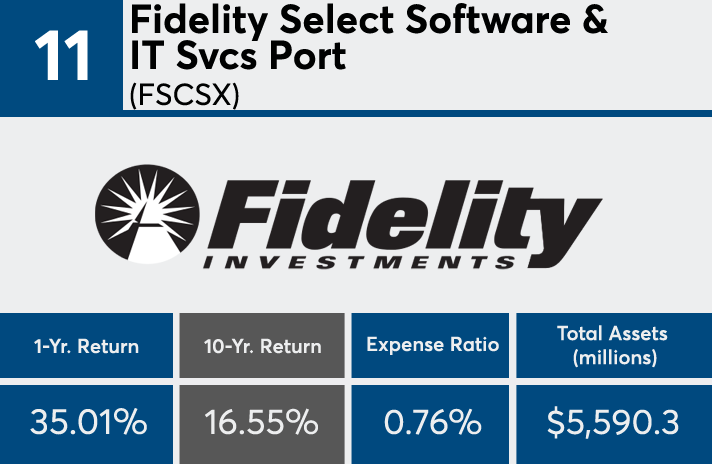
11. Fidelity Select Software & IT Svcs Port (FSCSX)
10-Yr. Return: 16.55%
Expense Ratio: 0.76%
Total Assets (millions): $5,590.25

10. Fidelity Advisor Biotechnology I (FBTIX)
10-Yr. Return: 16.73%
Expense Ratio: 0.78%
Total Assets (millions): $2,830.33

9. Fidelity Select IT Services (FBSOX)
10-Yr. Return: 16.93%
Expense Ratio: 0.79%
Total Assets (millions): $2,307.8

8. PRIMECAP Odyssey Aggressive Growth (POAGX)
10-Yr. Return: 17.13%
Expense Ratio: 0.64%
Total Assets (millions): $10,511.3
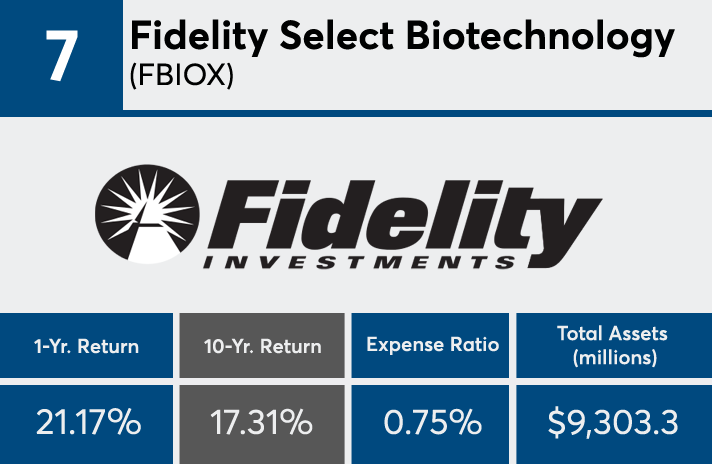
7. Fidelity Select Biotechnology (FBIOX)
10-Yr. Return: 17.31%
Expense Ratio: 0.75%
Total Assets (millions): $9,303.3

6. First Trust Dow Jones Internet ETF (FDN)
10-Yr. Return: 17.90%
Expense Ratio: 0.54%
Total Assets (millions): $6.293
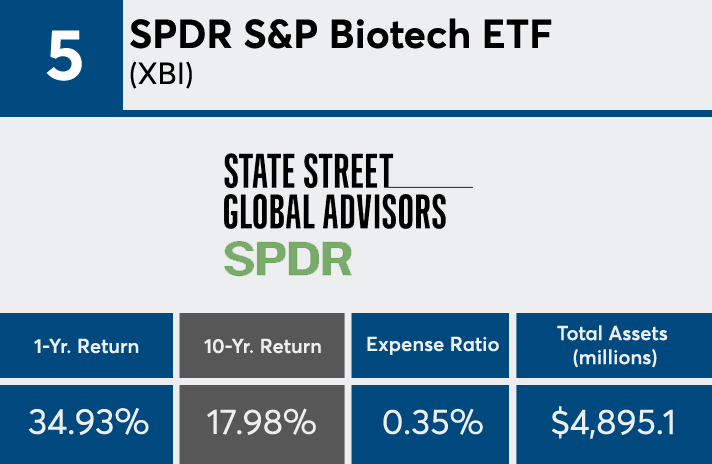
5. SPDR S&P Biotech ETF (XBI)
10-Yr. Return: 17.98%
Expense Ratio: 0.35%
Total Assets (millions): $4,895.1

4. Fidelity Select Retailing (FSRPX)
10-Yr. Return: 18.33%
Expense Ratio: 0.78%
Total Assets (millions): $2,342.1
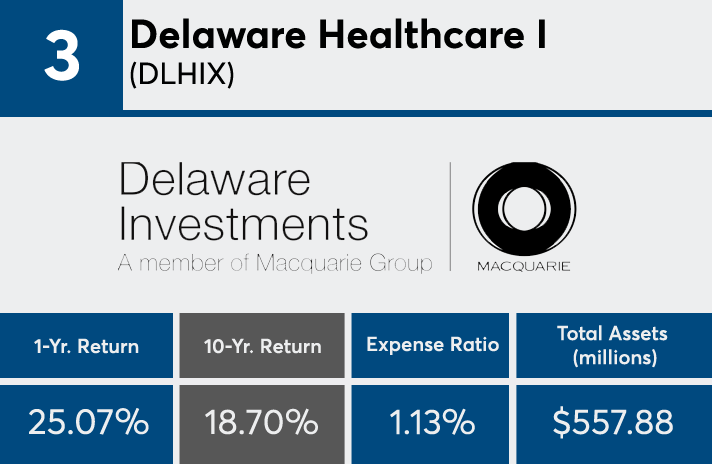
3. Delaware Healthcare I (DLHIX)
10-Yr. Return: 18.70%
Expense Ratio: 1.13%
Total Assets (millions): $558

2. T. Rowe Price Global Technology (PRGTX)
10-Yr. Return: 19.86%
Expense Ratio: 0.90%
Total Assets (millions): $7,021.2

1. First Trust NYSE Arca Biotech ETF (FBT)
10-Yr. Return: 20.03%
Expense Ratio: 0.56%
Total Assets (millions): $1,417.3


