Fees directly reduce portfolio returns … and that comes directly out of the pocket of the investor. There is no way to say that gently.
Understandably, mutual funds and ETFs have to charge something. Money management isn’t free. Additionally, many advisers charge clients an AUM-based fee.
What is the impact of different fee levels in a retirement portfolio over a period of 25 years from age 70 to 95? To put it bluntly, it’s huge.
CREATING A BASELINE
To evaluate the impact of fees (the expense ratios of the funds in the portfolio and the advisory fee if applicable), we need to have a low-cost retirement portfolio to act as a baseline for comparison. The baseline portfolio in this analysis consisted of seven indexes.
For this index portfolio, a baseline fee level of 50 bps was assumed. No advisory fee was assumed; the 50 bps simply covered the collective expense ratio of the underlying funds.
If your investment time frame has been seriously long term, these are the funds that posted the best returns over the long haul.
This portfolio simulates what an individual investor would pay as a do-it-yourselfer or if using a robo advisory service. The example further assumes that the investor is in his or her retirement years.
The retirement portfolio consisted of the following indexes: S&P 500, Russell 2000 Index, MSCI EAFE Index, Dow Jones REIT Index, S&P GSCI, Barclays Aggregate Bond Index and 90-day U.S. Treasury bills. These indexes cover the major asset classes that portfolios typically contain: large-cap U.S. stocks, small-cap U.S. stocks, non-U.S. stocks, real estate, commodities, U.S. bonds and cash. Each asset class was equally weighted at 14.29%, and the portfolio was rebalanced at the end of each year.
The analysis of the impact of fees assumed a retirement portfolio that began with $1 million and evaluated the ending account balance over rolling 25-year periods. The 25-year period represents a retirement lasting from age 70 to age 95.
In real life, of course, retirement periods are shorter and some are longer, but 25 years seemed a reasonable estimate for this type of analysis. The first 25-year period was from 1970 to 1994. The second was from 1971 to 1995, and so on.
There were 23 rolling periods of 25 years in this study. The amount of money withdrawn from the portfolio each year was determined by the required minimum distribution specified by the IRS for tax-deferred retirement accounts. The annual performance of the portfolio was calculated by using the actual historical returns of the stated indexes.
'HUGE' IMPACT
From a starting portfolio size of $1 million, the ending account balance in the first 25-year period (1970-1994) was $3,491,175. The total amount of money withdrawn using the RMD during this particular 25-year period was $4,421,584; this equaled an average annual withdrawal of $176,863. These results assumed a total portfolio cost of 50 basis points. All of these figures are in nominal terms, meaning that inflation has not been accounted for.

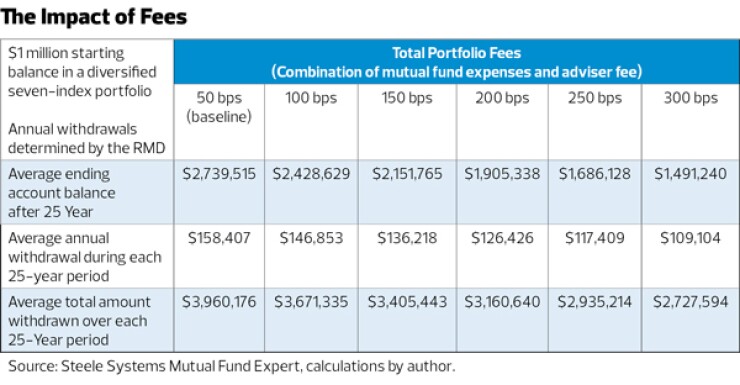
Of course, that is only one particular 25-year period. There were 23 rolling 25-year periods between 1970 and 2016. A summary of the results for all 23 periods is shown in the table “The Impact of Fees.” The average ending account balance was $2,739,515, assuming total fees of 50 bps. The average annual withdrawal based on the RMD was $158,407, and the average total amount withdrawn over each of the rolling 25-year periods was $3,960,176.
Next, we introduce a total fee level (combining mutual fund expense ratios and advisory fees) of 100 bps. At this fee level, the average ending balance drops by $310,886, to $2,428,629 — a decline of 11.3%. The average annual withdrawal declined by $11,554, to $146,853 — a 7.3% drop. Finally, the average total withdrawal declined by $288,841, to $3,671,335 — also a 7.3% drop.
The relative declines in the ending balance and the average annual withdrawal tended to hold all the way across the table. For each additional 50 bps of cost, the average ending balance of the retirement portfolio declines by roughly 11.5% and the average annual withdrawal from the portfolio declines by roughly 7.2%.
Think of it this way: if a portfolio had a total cost of 100 bps and by using lower cost products or reducing the advisory fee the total portfolio cost could be halved to 50 bps, the retiree could withdraw $11,554 more from their portfolio each year and her ending account balance would be higher by roughly $310,886 after 25 years.
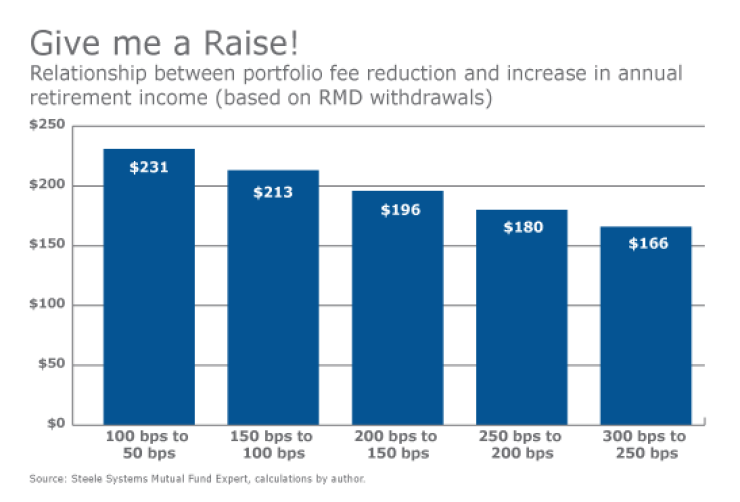
The increase in annual withdrawal of $11,554 was associated with a 50 bps reduction in cost; therefore each basis point of cost reduction increased the annual portfolio withdrawal by $231.
As shown in the chart “Give Me a Raise!” when reducing the total portfolio cost from 100 bps to a lower fee level, each basis point of cost reduction added $231 to the retiree’s income each year (based on RMD-based annual withdrawals).

For a portfolio that starts at 150 bps each basis point of cost reduction equals $213 more for the retiree each year. For a portfolio that starts at 200 bps, each basis point of cost reduction translates to $196 more for the retiree each year.
The payoff of cost reduction to the end user is huge and vital for advisers who plan to stick around. Cost reduction is the new sheriff in town. Said differently, advisers need to create the same cost effectiveness for their clients that they would want for themselves. That’s what a fiduciary would do.
Clearly, the importance of keeping portfolio costs down has never been greater. But there is good news: building a multi-asset retirement portfolio need not be expensive. To illustrate this I have shown the aggregate expense ratio of a 12-asset class model known as the 7Twelve Portfolio across several different fund providers. (Disclosure: I am the designer of the 7Twelve Portfolio.)
As shown in the table “Low-Cost Diversified Retirement Portfolios,” such a retirement portfolio can be built in a variety of ways for under 55 bps — often well under that. If using actively managed mutual funds from various fund families the cost is around 54 bps. If using various ETFs, it can be built for 16 bps. If using Vanguard ETFs, the aggregate portfolio cost is 10 bps.

Cost is clearly not what would stop an adviser from building a multi-asset portfolio. Rather it is a decision to adopt a low-cost approach, which is easily facilitated by a number of large mutual fund families. Moreover, where you purchase the portfolio “ingredients” matters less than the asset allocation model that is employed.
This is visibly demonstrated by the similarity in the 15-year performance across the various 7Twelve models built with funds from different fund families. Again, the recipe (or asset allocation model) has the biggest impact on performance, not where you purchase the ingredients.
WHAT IF?
If you are currently using mutual funds in your client’s retirement portfolios that have an average expense ratio of 100 bps and you are also charging 100 bps advisory fee, your clients face a total cost of 200 bps. If you moved to low-cost ETFs, you could drop the expense ratio cost component down to 10 bps and if you lowered by advisory fee to 90 bps, your clients are all in at 100 bps.
What does that do for your client? It increases their retirement account balance 25 years later by more than $520,000, and it increases their annual portfolio withdrawal by over $20,000 each year for 25 years. In short, it changes their financial situation dramatically.
The era of high cost funds is over. Lower advisory fees and lower-cost investment products — whether they be index funds, actively managed funds or ETFs—is the right path. In fact, it is the only viable path in a competitive and cost-centric world.


