As the cost of college becomes more burdensome, parents have become increasingly interested in long-term planning to fund their children’s education. In turn, this has led planners to increasingly see college planning as an important value-add that can be provided to their clients. And given tuition inflation has continued to outpace CPI for some time now, setting an assumption for college expense inflation is crucially important for helping clients with their educational goals.
At its core, college expense planning is a fairly straightforward NPV calculation: How much does it take to fund four years of college expenses subject to some special rate of education inflation — that is, to account for the above-CPI-growth rate in college tuition and related expenses? In contrast to more complex methodologies for retirement planning — like historical analyses, Monte Carlo simulations, dynamic programming — college planning seems almost painfully simple.
Once a student is in high school, parents generally have at least a decent idea of what’s next for the student. On top of that, both the timing and the expense are fairly predictable.
Early on, advisors tend to make some basic assumption about college. For instance, attending school for four years, at age 18, based on the cost of either a particular in-state school or the client’s own alma mater. All that’s left is to make assumptions about the growth rate of college savings and the inflation rate for the cost of college itself.
And yet, as many parents are beginning to save into vehicles such as 529 plans earlier and earlier, it is worth taking a closer look at college expense planning assumptions — and the assumed inflation rate in particular, given the data in recent decades does not actually support some common advisor assumptions.
The reality is that college inflation varies significantly based on the income and wealth of the student and his or her family, the location of the college and even the type of educational institution they want to attend.
Assuming one standard inflation rate creates the risk of over- or under-saving. Parents could be faced with shortfalls when writing tuition checks or penalties when withdrawing excess college saving funds in the future.
TYPICAL PLANNING ASSUMPTIONS
The
What does the data tell us about historical tuition inflation rates? You may be surprised. For instance, looking back over the past 30 years, how would you guess current inflation-adjusted tuition inflation rates compare? If you guessed we are near 30-year lows, you would be correct.

Of course, this is not the impression that many people have.
Planners typically assume some college inflation rate that is materially higher than the general level of inflation (for example, CPI + 3%) when planning for college expenses. With a long-term average inflation rate at 3%, this means a typical college inflation rates assumption of 6%.
But in reality, the five-year real change in published tuition, fees and room and board from the 2011-2012 school year to 2016-2017 was a cumulative 13%, or just 2.4% annually for private nonprofit four-year institutions and 9% cumulatively, or just 1.9% annually for public institutions. By contrast, those inflation rates from 1981-1982 to 1986-1987 were 35%, or 6.2% annually at private institutions and 30%, or 5.4% annually at public institutions.
Notably, the rolling five-year inflation rate at private colleges has hovered around 2.5% per year — or about 13% cumulatively over five years — for more than two decades. Similarly, rolling five-year college inflation rates at public institutions have been on a fairly steady downward trend since the early 2000s, though it remains to be seen whether inflation rates will remain at lower levels or rebound as they did coming out of the late 1990s.
In other words, even though advisors typically assume college costs will increase at a real rate of 3%, the real rate of change is now below that level — and for private colleges in particular, it has been so for almost 25 years.
Beyond this general trend of declining college inflation rates though, there are at least three key sub-trends that advisors need be aware of as well: the variability of inflation by institution type, by location and by income of the student’s family.
INFLATION BY TYPE
The first factor to consider when helping a client determine the proper rate of college expense inflation is the type of institution their child is targeting. The “Trends in College Pricing 2016” report analyzes many different types of institutions, each of which can exhibit different rates of inflation. For most advisors, the most relevant categories are likely:
- Public four-year in-state,
- Public four-year out-of-state, and
- Private nonprofit four-year.
The differences in price levels between these groups are considerable. The average published price for public four-year in-state tuition, fees and room and board was $20,090, whereas the same cost at private institutions was $43,870. Yet while it is generally well known that there are differences in price levels — and advisors can easily look up these prices for any target school — the reality is that the inflation rate for these costs may also vary significantly.
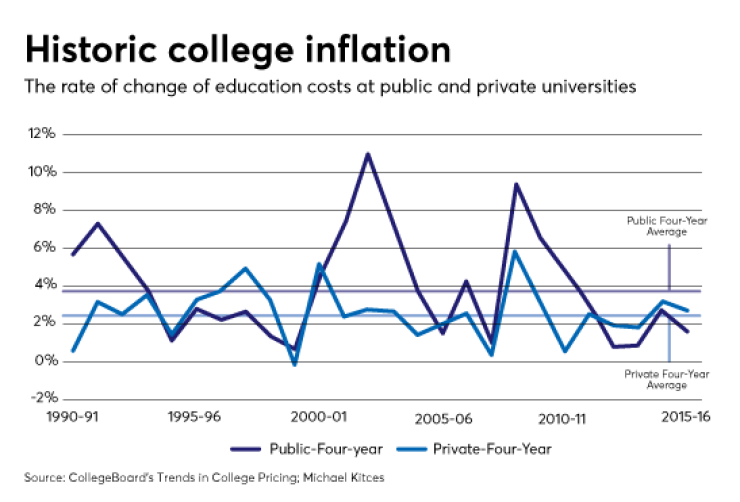
Based on the long-term data available, we can examine real, inflation-adjusted increases in published tuition and fees going back through 1990-1991 among public four-year and private nonprofit four-year institutions:
Looking at the chart above, of historical data since 1990, allows us to make several observations. First, since 1990, changes in average tuition and fees have been more volatile at public institutions than at private institutions. In fact, the standard deviation of real changes over this time period was 2.8% for public institutions and 1.4% for private institutions.
This isn’t entirely surprising. Given public institutions have lower price levels and may operate on tighter budgets, it is likely that these institutions have less slack in their budgets, which may necessitate making more immediate adjustments in pricing. In contrast, private universities, may be able to make subtler adjustments in pricing, perhaps by economizing in other areas during lean times.
Additionally, when we examine the cumulative change in prices since 1990-1991, it becomes apparent how small divergences in inflation rates can be compounded over longer time horizons. The geometric average real inflation rates at public four-year and private four-year institutions were 3.95% and 2.59%, respectively. As a result, in real terms, published tuition and fees at public four-year institutions rose 274% since 1990-1991, while the rate was only 194% at private four-year institutions.
The bottom line: While the baseline cost of public universities is lower than that of private colleges, advisors may want to consider using a higher inflation rate for children planning to go to public schools rather than private colleges — such as 4% vs. 2.5% above CPI, respectively.
INFLATION BY LOCATION
In addition to variation based on institution type, considerable differences in college inflation rates exist based on the location of the school.
From 2004-2005 to 2016-2017, cumulative real tuition and fee inflation at four-year public institutions ranged from a low of a 2% decline in Ohio (near 0% annually) to an increase of a 148% (7.9% annually) in Hawaii, followed by an increase of 145% (7.8% annually) in Washington, D.C.

Notably though, the variability in state-level college inflation isn’t entirely random. There is a weak correlation (r = 0.43) between real price increases in four-year public tuition and fees between 2005-2006 to 2015-2016 and state population growth over this time period.
This suggests that about 19% of the variation in public tuition and fee growth might be predicted by population growth. Of course, prices generally wouldn’t be rising merely because of population growth, but it’s quite possible that population growth rates may be indicators of a state’s attractiveness as a place to live, including its attractiveness among youth as a college destination — potentially meaning that at least some colleges must or can raise their prices as a result.
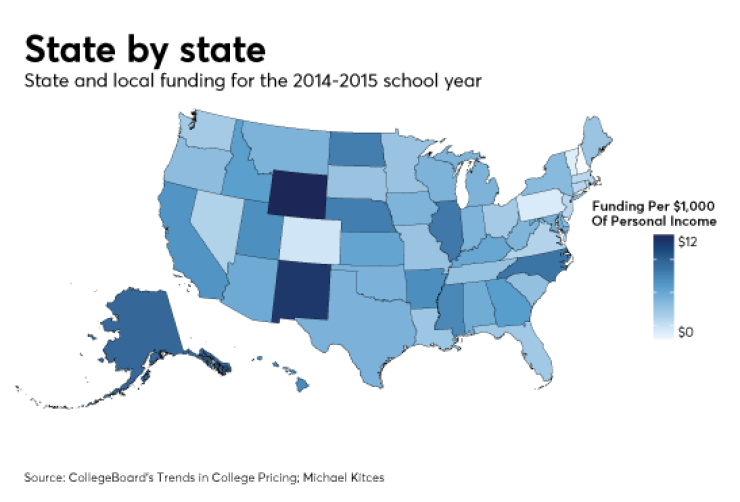
State and local finances also play an important role when it comes to in-state students at public universities. Trends in state level fiscal health and public policy can influence tuition inflation going forward. One notable trend is that on average, state and local funding for higher education per $1,000 of personal income has been declining over the last 30 years.

This chart shows that from total state and local taxes —

Not surprisingly, decreasing state and local funding for higher education shifts the cost burden onto students and their families, and we do see that reduced state and local funding is correlated with higher levels of tuition inflation (r = 0.34).
One additional factor included in the total cost of attendance, but not captured in tuition and fees, is room and board. Because of the localized nature of changes in economic factors which influence college prices at the local level — rental prices, for example — specific local trends will tend to wash out in state-level relationships. In practice, that means the trends in San Francisco are not the same as the trends in Fresno. Factoring in localized changes that influence the cost of college adds yet another level of complexity to planning for college expenses.
Of course, that doesn’t necessarily mean that previous trends will continue into the future, but the key point is that location does matter, and that lots of nuance is lost in the aggregate level statistics that are often used as the foundation for planning assumptions.
INFLATION BY INCOME
While sticker prices — that is, the official prices listed by a college — generally get most of the attention when it comes to education inflation, these prices are only paid by a small subset of college attendees. In fact, there’s a considerable gap between college sticker prices and the prices students actually pay — even for relatively affluent students.
Sticker prices, for example, are most commonly borne by international students and domestic students with income levels that eliminate them from aid eligibility.
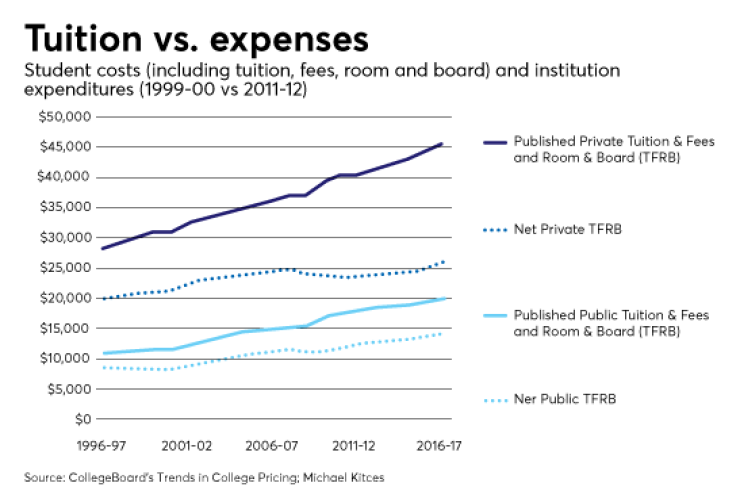
While average published tuition and fees for in-state students at public four-year institutions increased 41%, or 3.5% annually, in inflation-adjusted dollars between 2006-2007 and 2016-2017, average net tuition and fees — that is, what the average student actually paid after accounting for the aid they received — only rose by 30%, or 2.7% annually. In other words, nearly 25% of the increase in tuition and fees paid by the average student was actually covered by increasing amounts of student aid.

Notably, looking at the average student further masks considerable variability that exists among students given their family circumstances. For instance, while the average dependent student at a public four-year institution received a 16% discount off of published prices in 2011-2012, a student whose family was in the lowest income quartile received a 20% discount, whereas a student in the highest income quartile received a 13% discount.
Of course, even segmenting students into quartiles masks some of the true variability, as a student at the 76th percentile may not be receiving the same discount as a student at the 96th percentile — though some aid may be merit based which, based on relationships between socioeconomic factors and criteria for awarding merit aid, disproportionately goes to wealthier students. But still, even top-quartile students are paying 13% less on average than the published sticker price of a public institution.
And the gap was even wider in private four-year institutions. Although the average discount rate among students in 2011-2012 as 39%, the discount was actually 47% for students with families in the lowest income quartile, and 33% for students with families in the highest. In other words, even families in the highest income quartile are, on average, receiving discounts of 33% off of published prices at private colleges — and those discounts have been increasing in percentage terms over time.

Still though, the pace of discounting has been more aggressive for lower-income students than upper-income students, which results in different inflation rates based on the income level of the student. As a result, the net real in-state tuition and fees at four-year public institutions rose by 41%, or 2.9% annually, for the lowest quartile families and 59%, or 3.9% annually, for the highest quartile families from 1999-2000 to 2011-2012.
This means that not only have the historical college inflation rates differed based on income, but that for the families advisors disproportionately work with — that is, highest quartile families — the standard 6% inflation rate (CPI + 3%) actually could be too low in some circumstances.
By contrast, at private nonprofit universities, tuition and fee inflation rates were actually lower for families in the highest income quartile. Real tuition and fee inflation rates based on the net cost of private college were 3% for families in the lowest quartile, but only 1.3% for families in the highest income quartile, over the same time period.
ASSUMPTIONS IN PRACTICE
One of the main benefits of simple college inflation assumptions is that they are just that: simple.
Yet as the College Board’s report so aptly demonstrates, there is a lot of complexity in understanding the true changes in college pricing over time. And while there’s always a risk that trends may reverse or may not be predictive of the future, the data still suggests it’s not best to simply use one rate of college expense inflation for all clients. In reality, we may want to at least shade our estimates in certain directions based on historical averages and current trends. And there are many situations where the standard CPI + 3% assumption is not a good fit at all.
Consider two examples where the underlying factors are the same.
Example 1: Public college
Suppose a child is interested in a public college. We may start by looking at the average tuition and fee inflation at public four-year institutions since 1990-1991. Given the geometric average real rate of tuition and fee inflation was roughly 4%, perhaps we feel comfortable starting with an assumption of CPI + 4%.
Next, we note that the client is in the highest income quartile which, in recent history, has experienced higher inflation rates by about one percentage point, so we bump the assumption up to CPI + 5%. Next, we note that over the past decade, schools within the state of interest have lagged national inflation rates by about 0.5% (see College Board’s report for state-specific details), so perhaps we decrease the assumption down to CPI + 4.5%. Finally, we note that state budget cuts have been reducing funding available for education and there is little indication that trend will change soon, so perhaps we adjust the final estimate back up to CPI + 5%.
Example 2: Private school
Suppose instead that the child is interested in private school. Since the geometric average real rate of tuition and fee inflation was roughly 2.5% since 1990-1991, perhaps we feel comfortable starting with an assumption of CPI + 2.5%. Next, we note that the client is in the highest income quartile which, in recent history, has experienced lower inflation rates by about 0.5 percentage points at private institutions, so we adjust the assumption down to CPI + 2%.
Next, we note that over the past decade, schools within the state of interest have lagged national inflation rates by about 0.5%, so we decrease the assumption further to CPI + 1.5%. Finally, though the state has recently seen budget cuts and there is little indication that trend will change — we make no adjustment for this trend because it has little impact on private colleges. Perhaps though, similar trends regarding an institution’s endowment and donor activity would warrant similar adjustments.
Notably, the baseline inflation rate has been lower in recent history than what is indicated above, and some of the relationships between different factors can be more complex than a simple chart can capture. But the key idea here is to illustrate the different steps and adjustments advisors may want to consider, customized to reflect their own views on college expenses going forward and the unique circumstances of their clients.
Of course on average, we would actually expect different factors to cancel out in many cases, as that is quite literally what an average gets at. Nonetheless, it’s important to guard against situations where all the indicators mostly point in one direction, and to recognize that the inflation trends for above-average-income students is not always what one might expect. Indeed, the inflation rate for the net cost of private colleges for upper-income students has only been 1.3% since 1999, but lower-income students at public institutions are still trending at close to 3% inflation above CPI.
In other words, at least a subset of college students may need to be prepared for significantly higher or lower college expense inflation going forward than the average figures imply.
Additionally, advisors may want to spend some further time investigating current trends in both their local market and key college destinations for their clientele. Of particular interest may be states like California and Texas which, according to the “Trends in College Pricing 2016” report, enroll 22% of the nation’s public college students.
Additionally, the Census Bureau has lots of great data for looking at certain demographic trends, and most state governments provide fairly extensive information regarding local budgets online.
In the end, there’s no one right way to do college expense planning, but the data is available to help advisors try to identify trends and customize the all-important inflation assumption for college expenses to a particular client’s situation.
So what do you think? Should financial advisors use one college expense inflation assumption for all clients? What college inflation assumption do you use? Please share your thoughts in the comments below.


