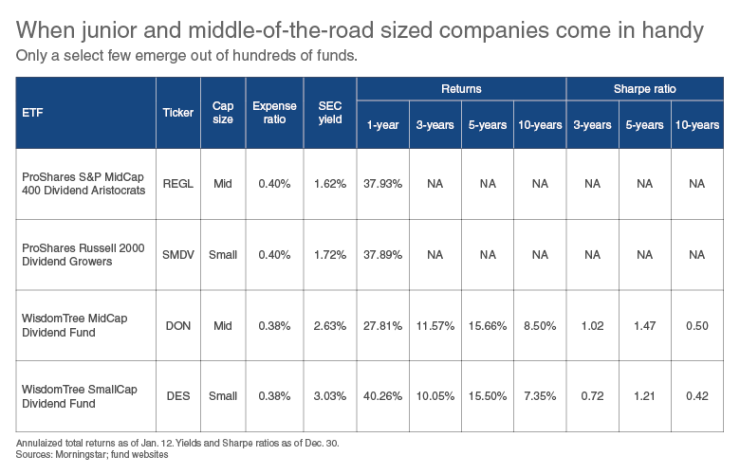
Advisers looking to include small- and mid-cap issues as part of a balanced domestic equities portfolio can look to ETFs for somewhat easy and inexpensive options. But if the plan is to feature dividend-focused small- and mid-cap ETFs, there are limited choices to pick from.
Of close to 2,000 ETFs available in the U.S., a search revealed only four that are exclusively dividend-driven and which also hold just domestic small- or mid-cap stocks. Two of the portfolios feature issues that have exhibited dividend growth while the other two ETFs include all dividend payers in their capitalization range.
But why should you look at both capitalization size and dividend focus?
Historically, smaller stocks have outperformed their larger-capitalization counterparts. And, except for periods like the dot-com bubble of the late 1990s, dividend payers have usually outpaced non-payers. Although the past can’t guarantee the future, it does make sense for advisers to see that their clients have at least some exposure to smaller-capitalization dividend-paying equities.
Even picking among the four ETFs that emerged after combing through multiple funds is difficult, because two were launched in 2015 and, therefore, have limited performance records.

Here is a look at the details behind all four::
ProShares S&P MidCap 400 Dividend Aristocrats ETF (REGL, 0.40%) holds 44 issues from the S&P MidCap 400 that have increased their dividend payments for at least 15 consecutive years. The fund must contain at least 40 stocks. If fewer than 40 issues qualify, the underlying index can include stocks with shorter dividend growth histories. Market caps of stocks in the index range from $1.5 billion to $8.9 billion. Stocks are equally weighted. Top sectors are financials, industrials and utilities. A sector may not exceed 30% of the index’s weight.
ProShares Russell 2000 Dividend Growers ETF (SMDV, 0.40%) owns 59 stocks from the small-capitalization Russell 2000 that have increased their dividends for 10 consecutive years. If fewer than 40 issues have a 10-year dividend increase history, the underlying index can include stocks with shorter histories. The smallest stock in the index has a market cap of $492 million, while the largest totals $4.99 billion. Stocks are equally weighted. Utilities, industrials and financials are the three largest sectors in the fund. Sectors are capped at a 30% weighting.
WisdomTree MidCap Dividend Fund (DON, expense ratio 0.38%) contains roughly 400 positions weighted by each stock’s percentage of the regular cash dividends paid by all the companies in the index. Almost 87% of the stocks in the underlying index have market capitalizations of between $2 billion and $10 billion. WisdomTree starts by eliminating the 300 largest-cap stocks in its base index of all domestic dividend payers. Issues that constitute the top 75% of the remaining market capitalization are included in MidCap portfolio. Consumer discretionary, real estate, and industrials are the three top sectors.
WisdomTree SmallCap Dividend Fund (DES, 0.38%), consists of about 700 stocks weighted by the same methodology as DON. More than 60% of the stocks in the underlying index have market caps of less than $2 billion. The index is composed of stocks that constitute the bottom 25% of the market cap of the base index of all dividend payers after the 300 largest-cap issues are removed. Top sectors are consumer discretionary, industrials, and real estate.
-
These funds have similar goals, but there are significant differences.
November 21 -
With a dearth of income alternatives for clients, advisers need to know that there are still some stocks that can do the trick.
August 18 -
Buybacks are good for company execs. But are they good for portfolios?
July 7
Aside from the question of all dividend payers vs. dividend growth stocks, there is the matter of which capitalization size to choose. For 2016, the only calendar year in which all four portfolios were available, small caps significantly outperformed as both DES (up 31.05%) and SMDV (up 35.55%) bested DON (up 20.29%) and REGL (up 29.97%).
Over time, however, the return for the amount of risk taken looks somewhat better in the mid-cap space. Morningstar data shows the three- five- and 10-year Sharpe ratios of DON higher than those of DES.
Since REGL and SMDV don’t have comparable Sharpe ratios available, another data set may help. For the 20-year period ended in 2016, S&P Dow Jones Indices reports that the annualized total return for the S&P SmallCap 600 was 10.11%, beating the S&P 500’s 7.58%. But the S&P MidCap 400’s annualized total return was 11.17%.
Although all three benchmarks contain payers and non-payers, the numbers show slightly better returns for the midcap space. Nevertheless, both midcaps and small caps beat the large caps, providing a worthwhile reward for the amount of research that it takes.


