Conventional wisdom is that companies paying dividends are past their prime. It’s also widely believed that small-cap stocks offer more growth potential than large-cap issues.
The first assertion
What then should advisers make of small-cap dividend paying stocks? The numbers show that, over the long term, they outperform small-cap non-payers and exhibit lower volatility. Using Compustat data, small-cap manager Royce & Associates recently studied the performance of payers vs. non-payers in the Russell 2000 index from 1993 through 2015. Stocks were resorted each month into one of the two categories and performance calculations made using month-end data.
The
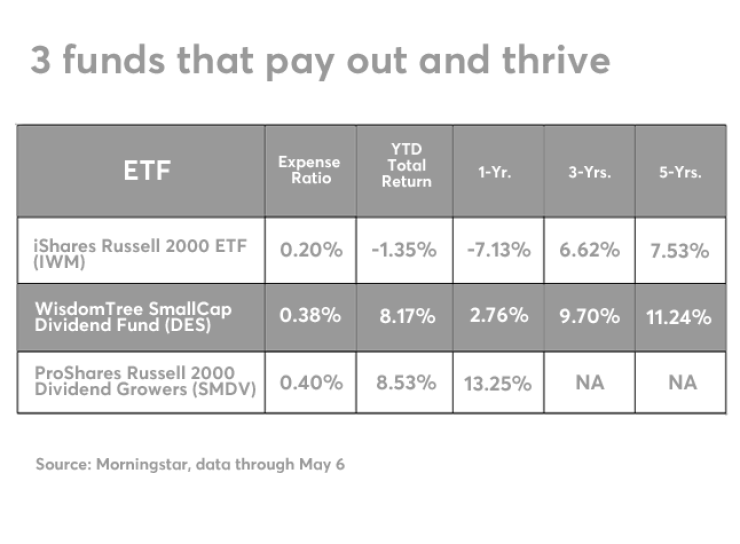
While Royce did the work of separating payers and non-payers in the Russell 2000, index supplier FTSE Russell has yet to take on that task for the marketplace. The company does offer a benchmark of stocks in the small-cap index that have increased dividends annually for 10 or more years. It’s available as an ETF, the ProShares Russell 2000 Dividend Growers (SMDV, expense ratio: 0.40%). But long-term dividend increasers can be very different from dividend payers, and SMDV was launched a little more than a year ago, so there’s not much real-time history to go on.
Advisers looking for an easy way to buy the domestic small-cap dividend universe can do so via the WisdomTree SmallCap Dividend Fund (DES). How does the performance of DES compare with that of iShares Russell 2000 ETF (IWM), which includes both payers and non-payers?

Morningstar calculates that DES beat IWM in total return for the year-to-date, one-year, three-year and five-year periods ending May 6, 2016. The DES outperformance was consistent whether calculated using market price or net asset value. DES was launched in June 2006, so next month brings performance data to compare with IWM’s 10-year record.
Although both funds hold small-cap stocks, they are significantly different portfolios. IWM tracks the Russell 2000, owns 1,947 stocks, and has 19% annual turnover. About 3% of assets are in the top 10 holdings. DES uses a proprietary WisdomTree index, holds 708 stocks, and has 33% annual turnover. About 10% of its assets are in the top 10 holdings.
Neither fund has a yield that will make clients rich: IWM’s 12-month trailing yield is 1.49% vs. DES’s 2.92%. DES is more costly to own with an expense ratio of 0.38% vs. IWM’s 0.20%.
Although ProShares Russell 2000 Dividend Growers (SMDV) is too new for anyone to say that it presents a better small-cap dividend approach, its one-year total return based on NAV is 13.25% vs. 2.76% for DES. On a year-to-date basis through May 6, the returns are much closer with DES at 8.17% and 8.53% for SMDV, according to Morningstar.
Why the significant outperformance of SMDV for the one-year period? Small-cap energy stocks may hold the answer. Few would have had a 10-year dividend-increase record to qualify for SMDV. But any small-cap energy stock that paid a dividend would have made it into DES. And DES would have had to hold them until they eliminated their dividends amid the oil-price decline.


