When it comes to bonds, think about taking a trip out of the U.S.
U.S. bonds face a challenging headwind in the coming years as
Very simply, as the U.S. interest rate increases, there will be downward pressure on the performance of U.S. bonds and U.S. bond mutual funds and ETFs.
-
The Fed chairwoman warned of the risks attached to waiting too long before raising rates.
November 17 -
Accelerating inflation will be a focus of next month’s meeting.
November 2
At least, that’s how the relationship has worked in the past. For example, the 34-year period from 1948 to 1981 saw rising interest rates (the federal discount rate went from 1.34% in 1948 to 13.42% in 1981).
During that “headwind” period, U.S. bonds (as measured by the SBBI U.S. Intermediate Government Bond Index from 1948 to 1975, and the Barclays Capital Aggregate Bond Index starting in 1976) produced a 34-year average annualized return of 3.83%.
By contrast, the 34-year period from 1982 to 2015 was a period of declining interest rates (the discount rate went from 11.02% in 1982 to 1% in 2015). During this “tailwind” period, the 34-year average annualized return of U.S. bonds was 8.15%.
We observe that, over lengthy periods, the general relationship between interest rate movement and bond performance is negative — that is, as interest rates go up, bond returns are lower, and vice versa.

While this relationship is true over 30-plus-year periods, it’s a less-than-perfect relationship over shorter time frames.
U.S. AND NON-U.S. BONDS
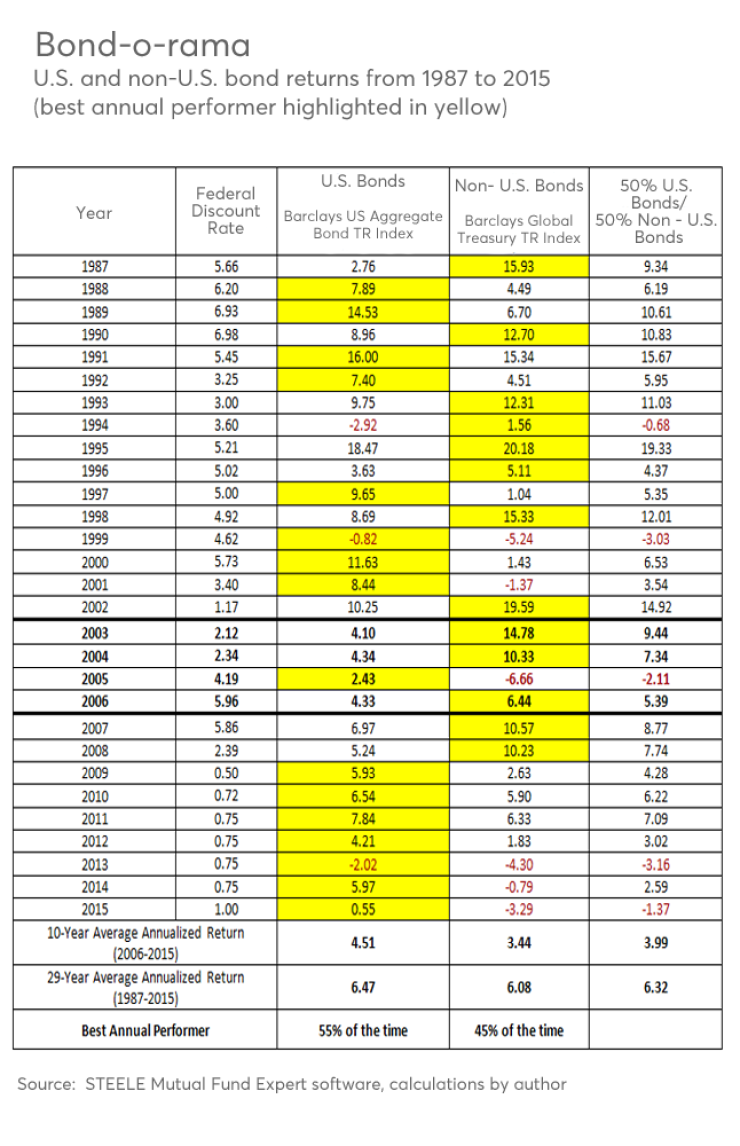
The returns of U.S. bonds and non-U.S. bonds over the past 29 years are shown in the chart “Bond-o-Rama.” This timeframe is used because it is as far back as we have performance data available for the Barclays Global Treasury Index (which is a measure of the performance of non-U.S. bonds).
Consider the four-year period from January 2003 to December 2006. At the end of 2002/start of 2003, the federal discount rate was 1.17%. By the end of 2006, it was 5.96% — a healthy increase of 479 basis points.
During that period, U.S. bonds posted returns of 4.10%, 4.34%, 2.43% and 4.33% — hardly a meltdown caused by rising rates. The average annualized return for U.S. bonds during that four-year period of rising rates was 3.80%.
Granted, that rate of return was lower than the 6.47% average annualized return over the entire 29-year period from 1987 to 2015. But an annualized return of 3.80% during four “headwind” years for U.S. bonds is hardly a train wreck.
Interestingly, during that same timeframe, non-U.S. bonds (as measured by the Barclays Global Treasury TR Index) had three excellent years and produced a four-year average annualized return of 5.91% from 2003 to 2006.
This illustrates the benefits of diversifying your fixed-income exposure – particularly during a period of rising U.S. interest rates. A 50/50 mix of U.S. and non-U.S. bonds during that same four-year period produced an annualized return of 4.92% – or over 110 basis points higher than the return if only invested in U.S. bonds (as measured by the Barclays Aggregate Bond Index).
BOND OUTPERFORMANCE … SOMETIMES
Interestingly, as we consider the entire 29-year period, we observe that U.S. bonds were the best performer 55% of the time (based on calendar-year returns) and non-U.S. bonds were the better performer 45% of the time. As previously noted, U.S. bonds produced a 29-year average annualized return of 6.47%, non-U.S. bonds had a 29-year annualized return of 6.08% and a 50/50 mix generated a 29-year return of 6.32%.
Over the past 10 years, non-U.S. bonds were the best performer three times: 2006, 2007 and 2008. However, since 2009, U.S. bonds have been the better performer of the two.
Indeed, the 10-year average annualized return for U.S. bonds has been 4.51% vs. 3.44% for non-U.S. bonds. But it will be no big surprise if performance leadership moves back over to non-U.S. bonds as U.S. interest rates begin to move upward.
When and by how much is not knowable in advance, but isn’t that exactly why we diversify in the first place?

HOW DIVERSITY PAYS OFF
Let’s consider two examples of the results achieved by blending U.S. bonds and non-U.S. bonds rather than simply using U.S. bonds in a portfolio.
The first example utilizes T. Rowe Price U.S. Treasury Intermediate (PRTIX) and T. Rowe Price International Bond (RPIBX) in a 50/50 split with rebalancing at the end of each year (see the chart “Bonded Together: A Case Study”).
-
Beyond risk questionnaires: How clients’ life stages should play a role in portfolio decisions.
August 8 -
Which periods produce the best long-term returns for different asset classes?
June 13
By itself, PRTIX had a 15-year average annualized return of 4.59% over the period from 2001 to 2015. By comparison, RPIBX had a return of 4.24% by itself. As a 50/50 pair, the 15-year return was 4.51%.
So why diversify?
We observe that T. Rowe Price International Bond had better annual returns than T. Rowe Price U.S. Treasury Intermediate slightly more than half the time. In some years, the performance differential was sizable (2002, 2003, 2004 and 2009).
Of course, that means PRITX beat RPIBX nearly half the time. And in some of those years, U.S. bonds outperformed by quite a margin (2001, 2005, 2008, 2011, 2014 and 2015).
It’s clear that these two funds march to different drummers. Very simply, that is what diversification of a portfolio is all about: combining ingredients that are different from each other so we diversify the “timing-of-returns” risk.
Said differently, the more diverse ingredients we include in a portfolio, the more likely it is that one or more of them will have a positive return in any given year. It’s important to have positive returns in some of a portfolio’s ingredients in case the client has an unexpected need to pull some money out (as well as the obvious issue of keeping the client pleased with some portions of her/his portfolio).
WHEN ONE OAR BREAKS
Portfolios that have fewer ingredients or a large number of highly correlated ingredients subject the investor to greater timing-of-returns risk — meaning that, if you have only two oars in the water and one breaks … well, you get the point.
Over the past 15 years, these two T. Rowe Price funds only had one year (2013) in which they both had a negative return, which is another manifestation of how different they are from each other.
Indeed, the 15-year correlation between the two was 0.24. This is a low correlation, which is great. These two T. Rowe Price bond funds, in a 50/50 rebalanced blend, had a 15-year return that was only 8 bps lower than PRTIX by itself, but had better annual returns than PRTIX 53% of the time, and had a standard deviation of return that was 36% lower than RPIBX by itself.
If you have only two oars in the water and one breaks … well, you get the point.
If using comparable funds at American Century (CPTNX as the U.S. bond fund and BEGBX as the non-U.S. bond fund), we see similar results. In this case, the 50/50 blend produced the highest 15-year average annualized return (1 bps higher than American Century Government Bond by itself and 15 bps higher than American Century International Bond by itself).
Moreover, the 50/50 blend produced better annual returns than CPTNX by itself 47% of the time, and had a 39% lower standard deviation than BEGBX by itself.
As of Oct. 31, 2016, the value of having exposure to non-U.S. bonds as well as U.S. bonds was evident.
The year-to-date performance of non-U.S. bonds was superior to U.S. bonds. It just makes sense to diversify among all the various asset classes in a portfolio—and the fixed-income portion of a portfolio is no exception. And while this analysis only highlights aggregate U.S. bonds and non-U.S. bonds, there are other fixed-income categories that can be considered (TIPS, municipal, GNMA, etc.).
The historical performance that was created by blending U.S. bonds and non-U.S. bonds is notable, but not highly compelling. But that is not the real issue. The real issue is creating a prudent approach to investing—and diversification is a foundational principle of being prudent.
It will be important –and prudent – to diversify the fixed-income portion of your client’s overall portfolio as we move forward into the headwinds.


