The industry’s worst-performing passively managed equity products have at least one thing in common: high fees.
In 2007, passive funds accounted for 20% of all U.S. equity assets, according to Morningstar data. Since then, that number has nearly doubled. In their search for low-cost products, clients moved $662 billion to the funds in 2017, alone. It’s no surprise that the average worst-performer cost significantly more than
“The more you split hairs, diving deeper into specific sectors or going country-specific, the higher the cost to operate the fund,” McBride says. “Even though passive funds hold a cost advantage relative to active funds, they’ll still carry higher costs than those invested in a broader index.”
The worst-performers had an average expense ratio of 0.70%, 50 basis points higher than the average index equity ETF, which fell to 0.21% in 2017 from 0.34% in 2009, according to ICI. These fees were actually closer to the cost of the average actively managed equity mutual fund, which fell to 0.78% in 2017 from 0.82% in 2016.
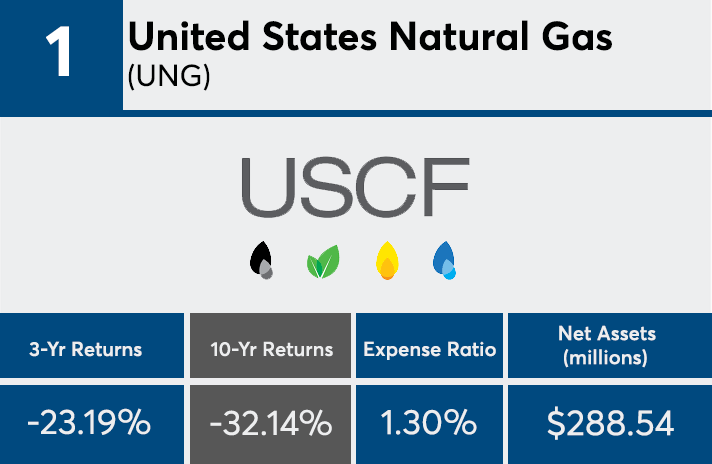
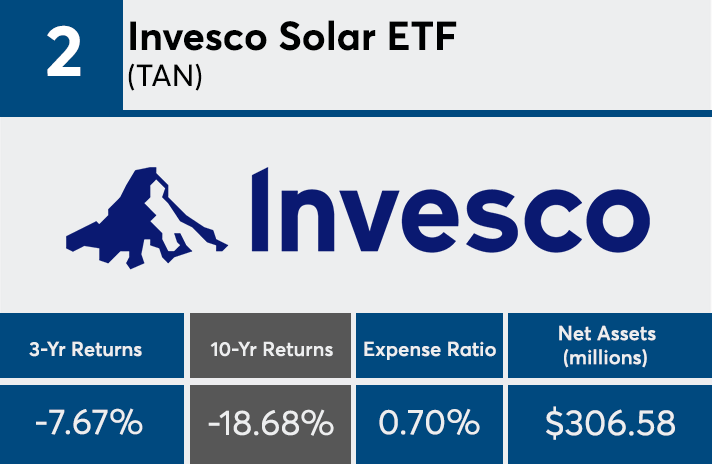
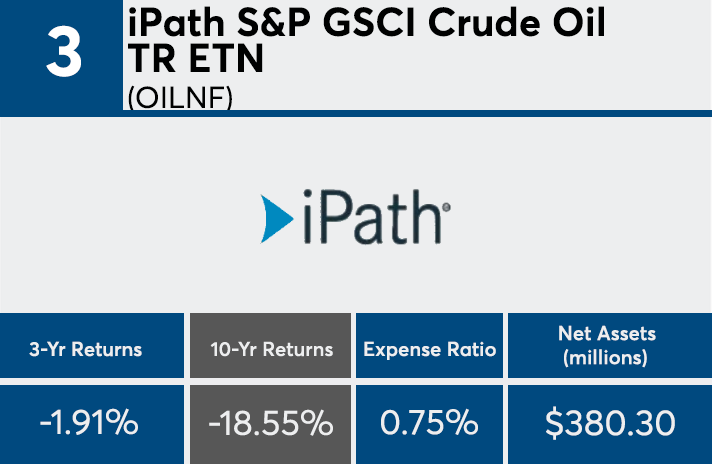
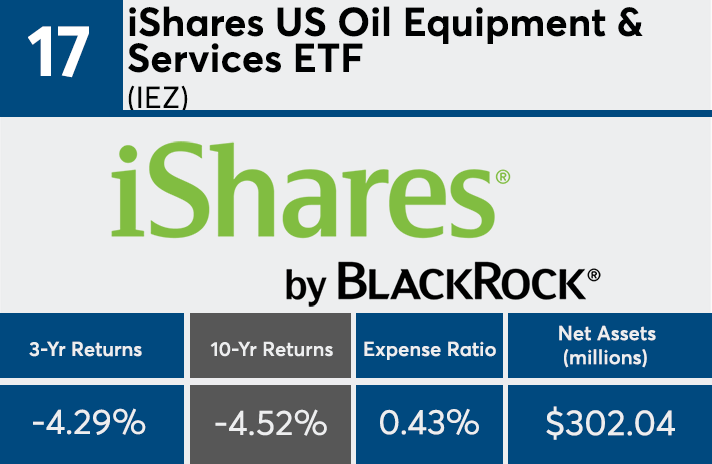
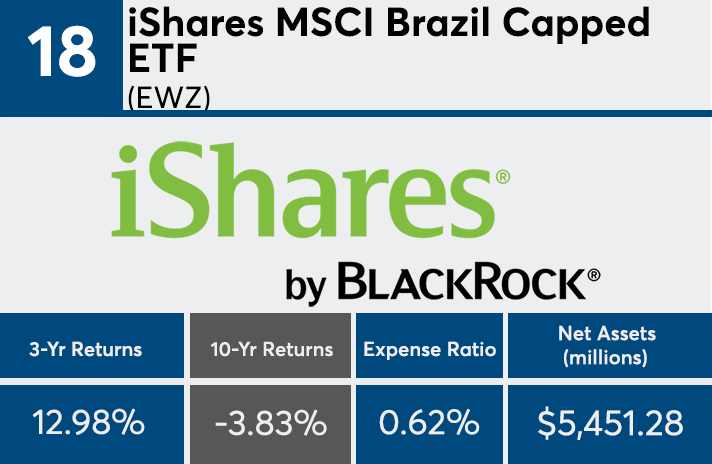
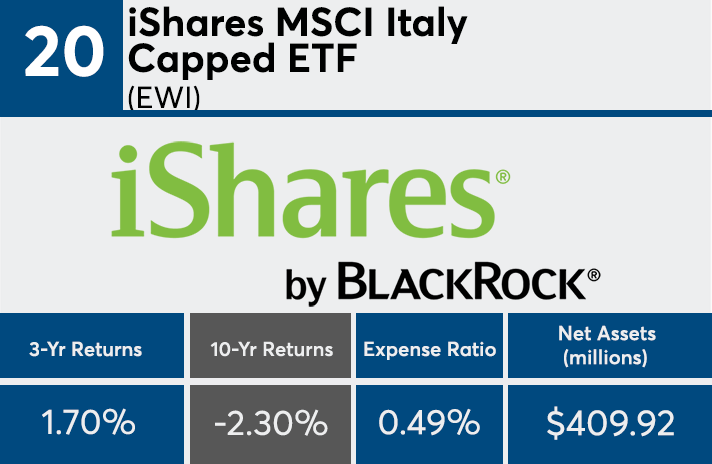
With returns ranging from -2.3% to more than -30%, the biggest losers of the past 10 years came from portfolios positioned in natural gas, crude oil and precious metals, according to Morningstar data. The worst 20 funds house a combined $27.3 billion in client assets.
Those sectors “struggled over the last decade, and in large part because there was a massive oil price unwind,” McBride says. “Seeing oil fall from $140 per barrel in 2008 to sub-$30 before beginning to rebound, sealed the fate for many of these funds.”
These returns, in particular, act as a reminder to advisors that they should not be in the business of chasing performance, McBride notes. “If you’re buying into a sector that has trounced the others, you’re likely setting yourself up for disappointing underperformance,” he says.
Scroll through to see the 20 passively managed funds with the worst returns over the past decade. Daily return figures are as of Sept. 6. Funds with less than $250 million in client assets and investment minimums over $100,000 were excluded, as were leveraged and institutional funds. We also show three-year returns, assets and expense ratios for each fund. All data from Morningstar Direct.
