Worst-performing funds of 2020

It has not been a good year for energy. Travel restrictions imposed due to coronavirus and the Russia–Saudi Arabia oil price war have sent stock holdings in oil and natural gas reeling. The result? Double-digit losses from some of the industry’s biggest energy funds.

The 20 mutual funds and ETFs with the biggest losses so far this year are largely from sectors including oil, energy and funds that focus on companies using the master limited partnership tax structure, according to Morningstar Direct data. These 20 funds, which are home to $40 billion in combined assets, generated an average loss of more than 40% this year.

Index trackers such as the SPDR S&P 500 ETF Trust (SPY) and the SPDR Dow Jones Industrial Average ETF Trust (DIA), meanwhile, generated a 4.21% gain and 4.3% loss, respectively. In bonds, the iShares Core U.S. Aggregate Bond ETF (AGG) has returned 7.72%, year-to-date.

“There was certainly a lot of tension back in the earlier part of the year,” CLS Investments CIO Marc Pfeffer says. “We saw oil prices drop, but aside from that, energy in general has just been hit hard this year. That is impacting three- and five-year numbers,” adding that if clients “looked just three months ago, these numbers would be glaringly different.”

To be sure, the funds on this list have also recorded losses over the longer term. With three- and five-year losses of 17.31% and 10.75%, the year’s 20 worst performers largely undershot the broader fund industry over longer timeframes. In the past three years, SPY and DIA recorded gains of 12.45% and 9.59%, data show. During the last five years, the index trackers gained 11.88% and 11.71%, respectively. The AGG also recorded gains over both three- and five-year periods of 5.58% and 4.42%, respectively.

The worst-performing funds in the first seven months of the year also came at a higher price than the broader industry, with an average net expense ratio of 72 basis points. That is well above the 0.45% investors paid on average for fund investing overall last year, according to Morningstar’s most recent annual fee survey.

“The biggest takeaway for clients is that if you diversify, as the economy recovers, energy funds should come back,” Pfeffer says. “It typically bodes well for you if you don't have all your eggs in one basket, in one company or in an individual sector.”

Scroll through to see the 20 mutual funds and ETFs with the biggest YTD losses through Aug. 5. Funds with less than $500 million in AUM and with investment minimums over $100,000 were excluded, as were leveraged and institutional funds. Assets and expense ratios, as well as YTD, one-, three-, five- and 10-year returns are listed for each. The data show each fund's primary share class. All data is from Morningstar Direct.

FP080420_20 copy.png

Global X SuperDividend ETF (SDIV)

1-Yr. Return: -27.24%
3-Yr. Annualized Return: -13.16%
10-Yr. Annualized Return: N/A
FP080420_19 copy.png

SPDR S&P Regional Banking ETF (KRE)

1-Yr. Return: -26.07%
3-Yr. Annualized Return: -9.63%
10-Yr. Annualized Return: 6.55%
FP080420_18 copy.png

Invesco Oppenheimer SteelPath MLP Income A (MLPDX)

1-Yr. Return: -37.38%
3-Yr. Annualized Return: -14.82%
10-Yr. Annualized Return: -3.28%
Front Load: 5.5%
FP080420_17 copy.png

Invesco Oppenheimer SteelPath MLP Alpha Y (MLPOX)

1-Yr. Return: -36.7%
3-Yr. Annualized Return: -16.91%
10-Yr. Annualized Return: -2.98%
FP080420_16 copy.png

Invesco Oppenheimer SteelPath MLP Select 40 Y (MLPTX)

1-Yr. Return: -37.34%
3-Yr. Annualized Return: -15.21%
10-Yr. Annualized Return: -1.69%
FP080420_15 copy.png

JHancock Regional Bank A (FRBAX)

1-Yr. Return: -27.44%
3-Yr. Annualized Return: -9.69%
10-Yr. Annualized Return: 6.98%
Front Load: 5%
FP080420_14 copy.png

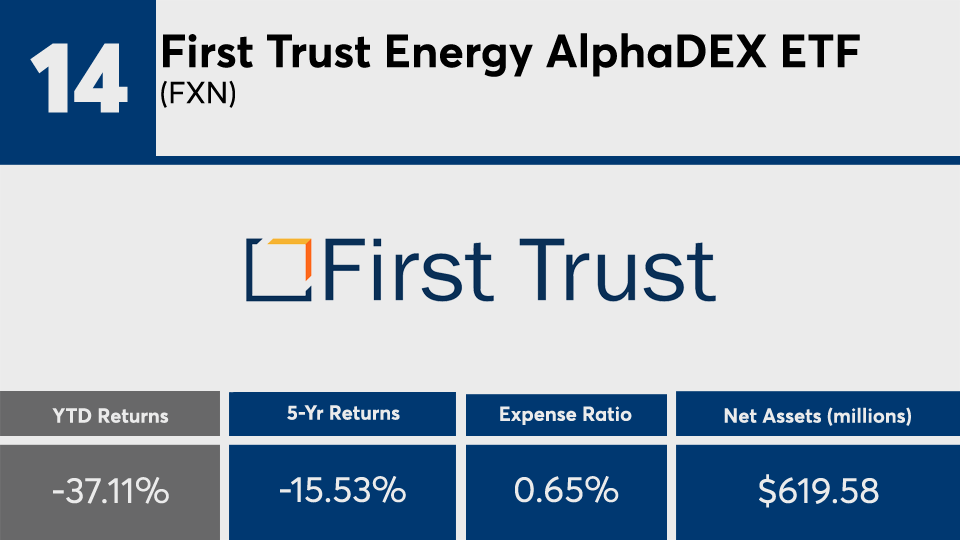
First Trust Energy AlphaDEX ETF (FXN)

1-Yr. Return: -34.22%
3-Yr. Annualized Return: -19.62%
10-Yr. Annualized Return: -7.68%
FP080420_13 copy.png

iShares Global Energy ETF (IXC)

1-Yr. Return: -33.17%
3-Yr. Annualized Return: -12.22%
10-Yr. Annualized Return: -2.36%
FP080420_12 copy.png

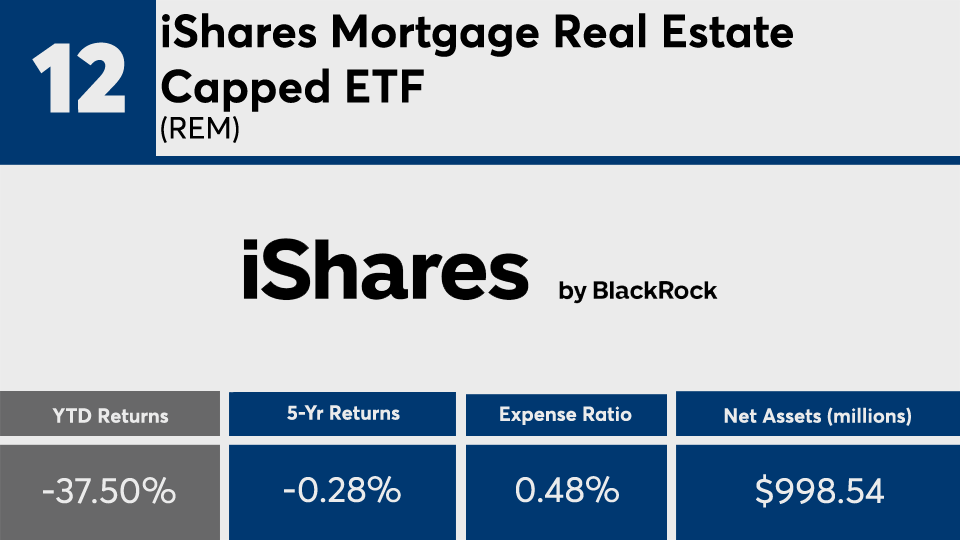
iShares Mortgage Real Estate Capped ETF (REM)

1-Yr. Return: -32.32%
3-Yr. Annualized Return: -9.01%
10-Yr. Annualized Return: 3.03%
FP080420_11 copy.png

Energy Select Sector SPDR ETF (XLE)

1-Yr. Return: -34.82%
3-Yr. Annualized Return: -13.69%
10-Yr. Annualized Return: -1.32%
FP080420_10 copy.png

Vanguard Energy ETF (VDE)

1-Yr. Return: -36.39%
3-Yr. Annualized Return: -15.41%
10-Yr. Annualized Return: -2.58%
FP080420_9 copy.png

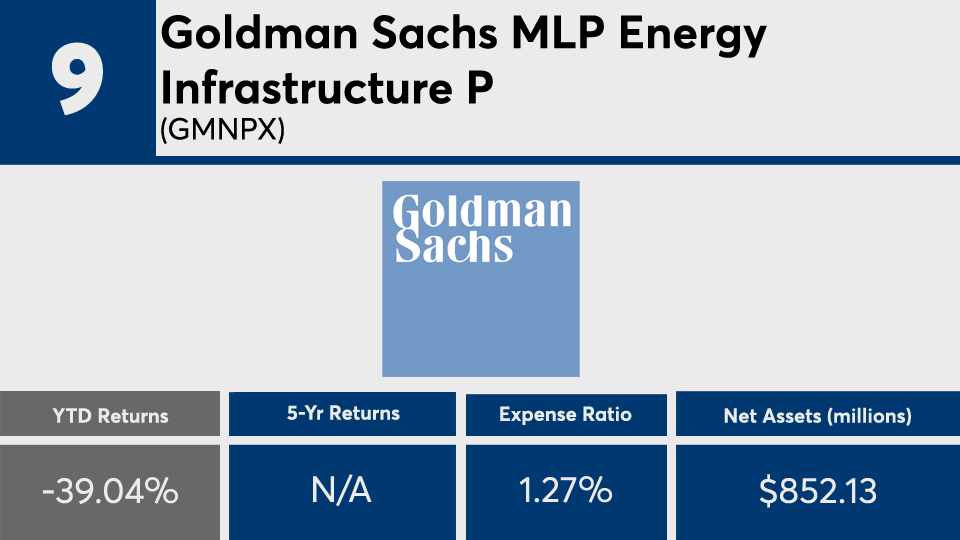
Goldman Sachs MLP Energy Infrastructure P (GMNPX)

1-Yr. Return: -42.74
3-Yr. Annualized Return: N/A
10-Yr. Annualized Return: N/A
FP080420_8 copy.png

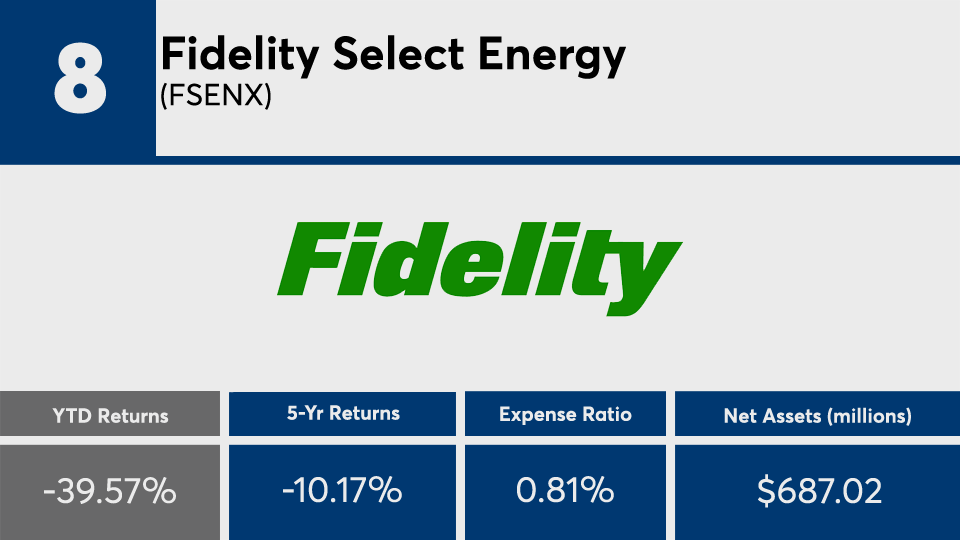
Fidelity Select Energy (FSENX)

1-Yr. Return: -36.49%
3-Yr. Annualized Return: -15.88%
10-Yr. Annualized Return: -3.47%
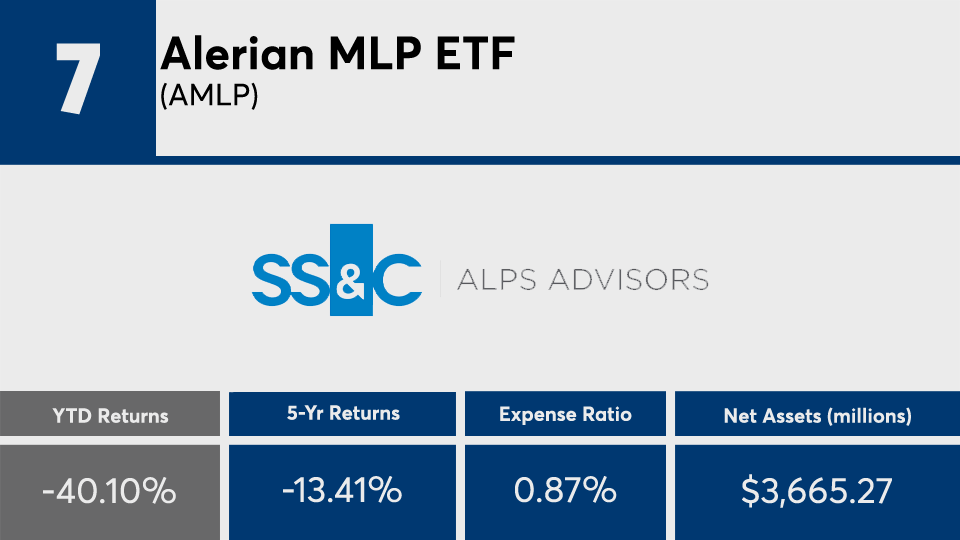
FP080420_7 copy.png

Alerian MLP ETF (AMLP)

1-Yr. Return: -44.62%
3-Yr. Annualized Return: -19.5%
10-Yr. Annualized Return: N/A
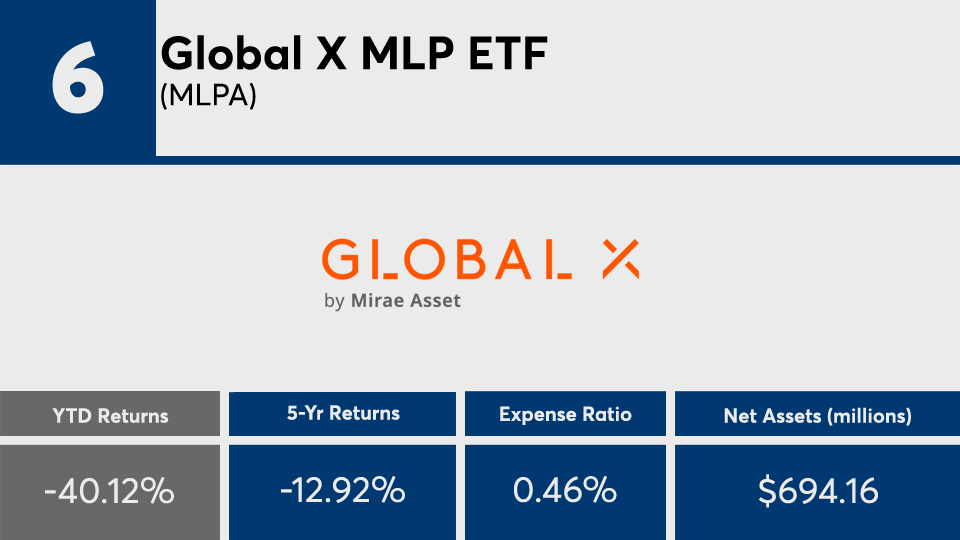
FP080420_6 copy.png

Global X MLP ETF (MLPA)

1-Yr. Return: -43.77%
3-Yr. Annualized Return: -19.03%
10-Yr. Annualized Return: N/A
FP080420_5 copy.png

(Center Coast Brookfield Midstream Focus Y CCCNX)

1-Yr. Return: -44.85%
3-Yr. Annualized Return: -19.62%
10-Yr. Annualized Return: N/A
FP080420_4 copy.png

SPDR S&P Oil & Gas Exploration & Production ETF (XOP)

1-Yr. Return: -42.66%
3-Yr. Annualized Return: -23.7%
10-Yr. Annualized Return: -10%
FP080420_3 copy.png

US Global Jets ETF (JETS)

1-Yr. Return: -47.79%
3-Yr. Annualized Return: -19.13%
10-Yr. Annualized Return: N/A
FP080420_2 copy.png

VanEck Vectors Oil Services ETF (OIH)

1-Yr. Return: -49.61%
3-Yr. Annualized Return: -34.48%
10-Yr. Annualized Return: N/A
FP080420_1 copy.png

United States Oil (USO)

1-Yr. Return: -68.01%
3-Yr. Annualized Return: -28.35%
10-Yr. Annualized Return: -20.57%
MORE FROM FINANCIAL PLANNING