Is there still a future for the 60/40 portfolio? With inflation on the rise and stocks continuing to make steady gains, investors’ increased willingness to take on risk has left a question mark hanging over the classic investment strategy.
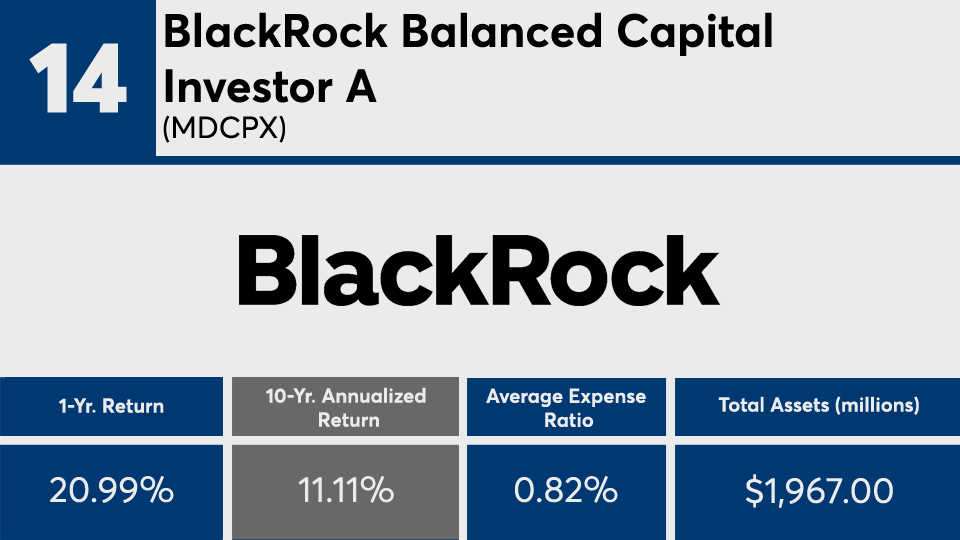
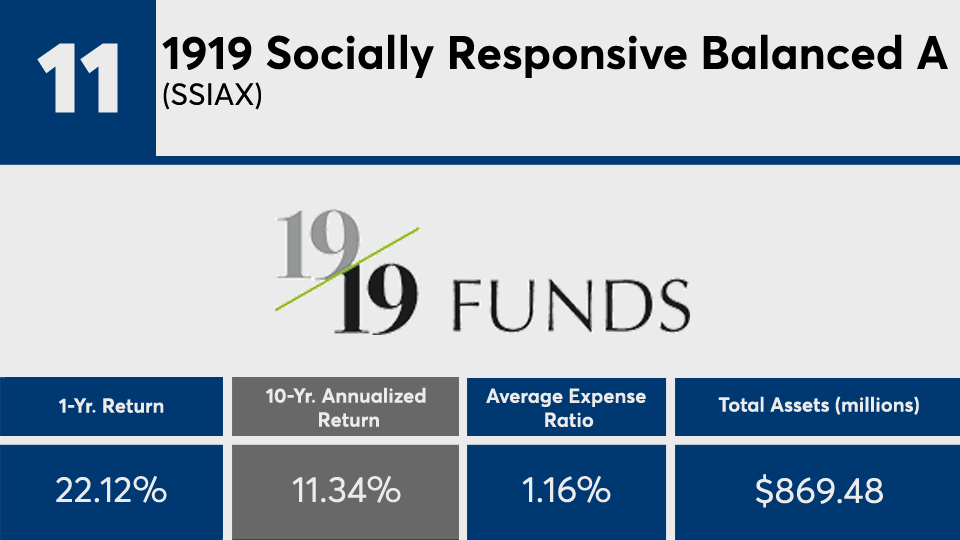
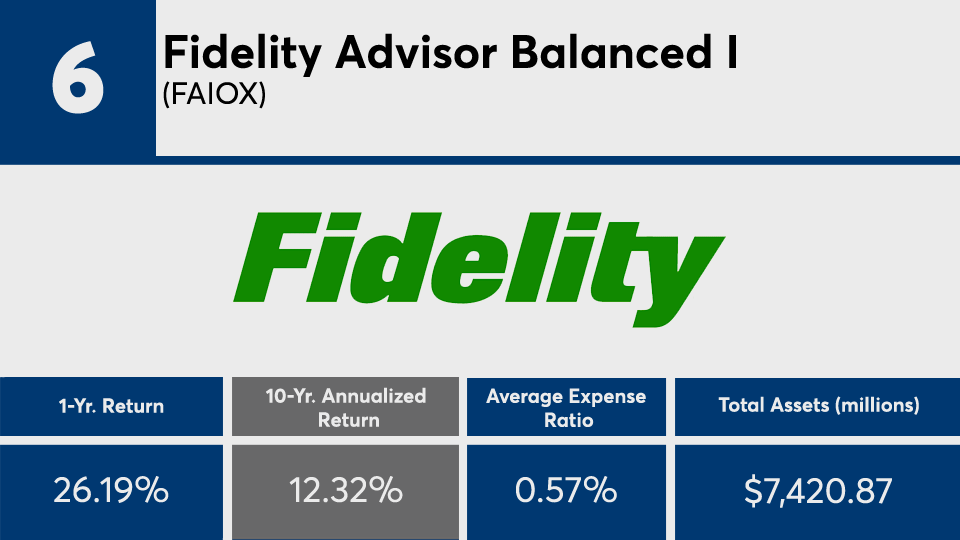
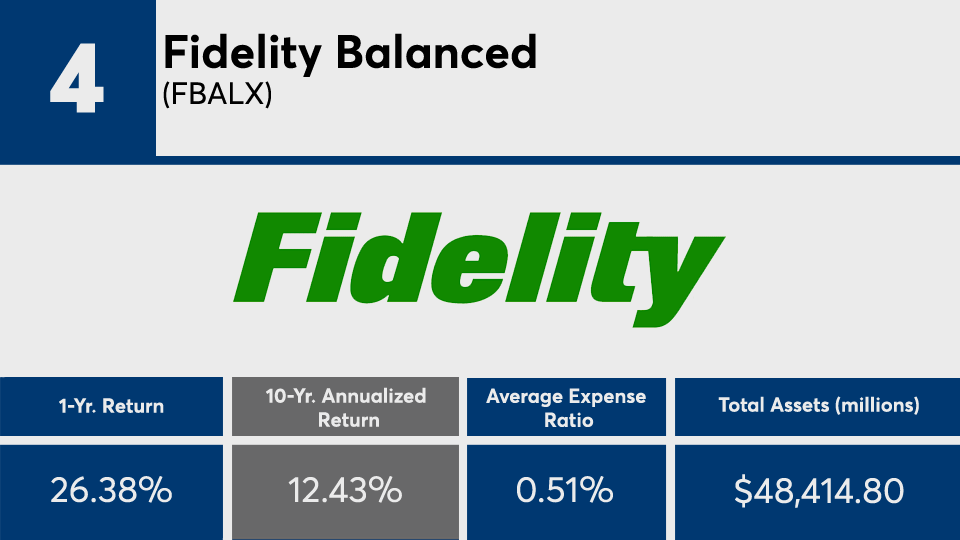
The decade’s 20 best-performing balanced funds with an equity allocation of 50% to 70%, and at least $100 million in assets under management, had an average return of 11.76%, Morningstar Direct data shows. Over the past 12 months, the same group of funds delivered an average gain of just under 22%.

For comparison, index trackers such as the SPDR S&P 500 ETF Trust (
In bonds, the iShares Core U.S. Aggregate Bond ETF (
While it’s clear the funds have not matched broader equity trackers, taking into consideration the AGG’s total return of 8.68% in 2019 and 7.42% in 2020, Mark Corcoran, CFA, OCIO at Tru Investment Services, said bonds may have held up their end of the bargain with investors.
“Total return for the 40 portion of traditional 60/40 portfolios over the past three and five years was 5.3% and 3.4%, even during periods of low nominal yields,” Corcoran said when analyzing the category. “Those total returns are well in line with most clients’ long-term capital market assumptions for investment grade, intermediate bond allocations. Given above-average equity returns, overall 60/40 total returns have been well above expected capital market assumptions.”
Fees among the funds in this ranking, however, are a different story. With an average net expense ratio of more than 75 basis points, the lineup of actively managed mutual funds here are well above the 0.41% asset-weighted average expense ratio across all funds in 2020,
“The top-performing fund in this matrix [has an expense ratio of] 69 basis points, but most clients forget that reported returns are net of expenses,” Corcoran said, adding, “Index fund costs average five basis points.”
For advisors with clients questioning the strategy’s long-term viability, Keel Point Chief Economic Advisor Steve Skancke said it is key to remember that “balanced fund managers operate within a range of equity and fixed-income allocations.
“Advisors should keep in mind their clients’ risk profiles,” Skanke said. “Each of these funds will have a benchmark against which their performance will be measured. The benchmark should be very close to where the asset class allocations are on average over time. So a balanced fund manager showing a 60/40 benchmark should be reasonably close to a 60/40 equity/fixed-income allocation most of the time, unless the manager has otherwise disclosed how much, when and why he or she will be above or below the benchmark allocation.”
Scroll through to see the 20 Morningstar category balanced funds with an equity allocation of 50% to 70%, a minimum AUM of $100 million, and the biggest 10-year annualized returns through Nov. 12. Asset allocation percentages in stocks and bonds, net expense ratios, loads, investment minimums, manager names, inception dates, as well as YTD, one-, three-, five- and 15-year returns and month-end share class flows through Nov. 1 are also listed. The data show each fund's primary share class. Leveraged, institutional and funds with investment minimums over $100,000 have been excluded. All data is from Morningstar Direct.


