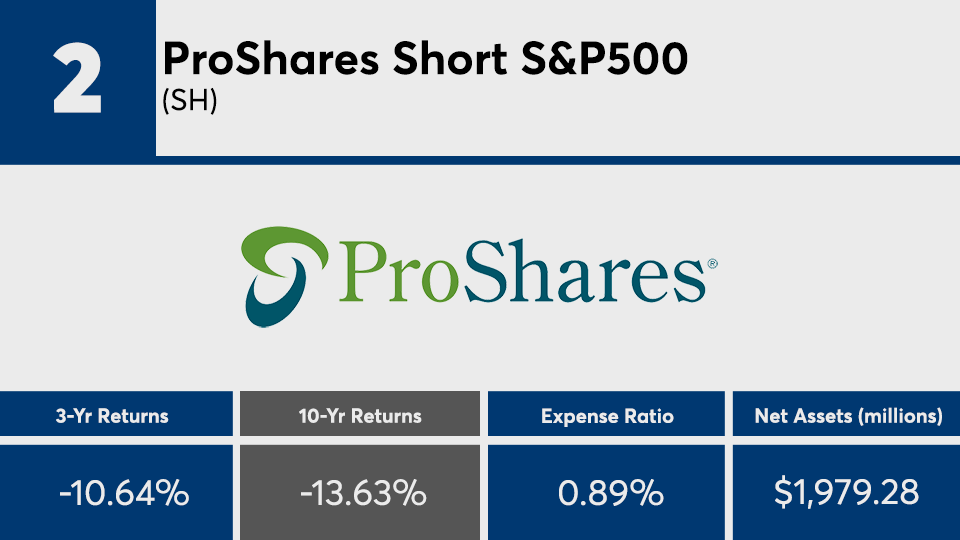
Putting all your eggs in one basket can be lucrative — but it's also risky. Shorting the market has been especially costly for those investing in some of the worst performing funds of the last decade.
“Talk about bad timing — shorting the market during the longest bull market on record,” Greg McBride, chief financial analyst at Bankrate, said in an email. “That’s a good way to lose a lot of money.”
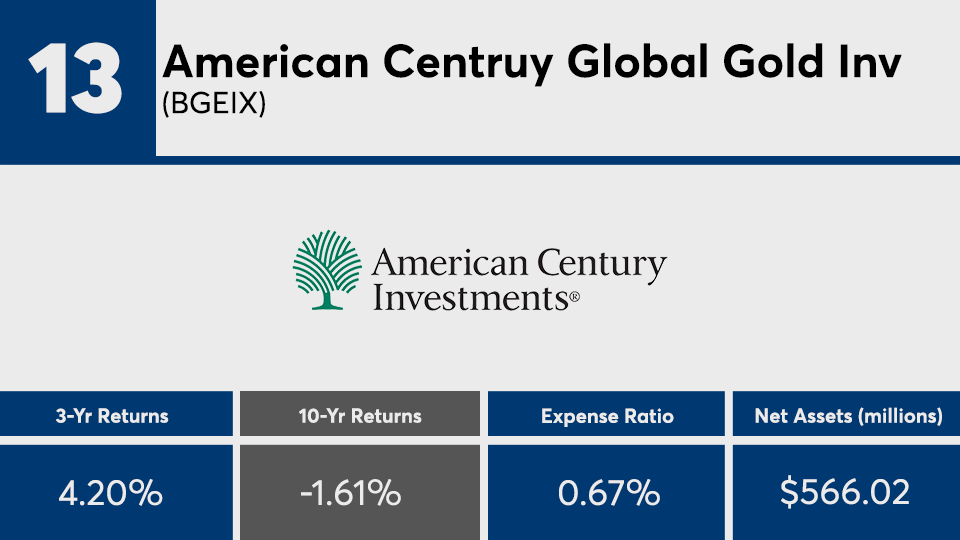
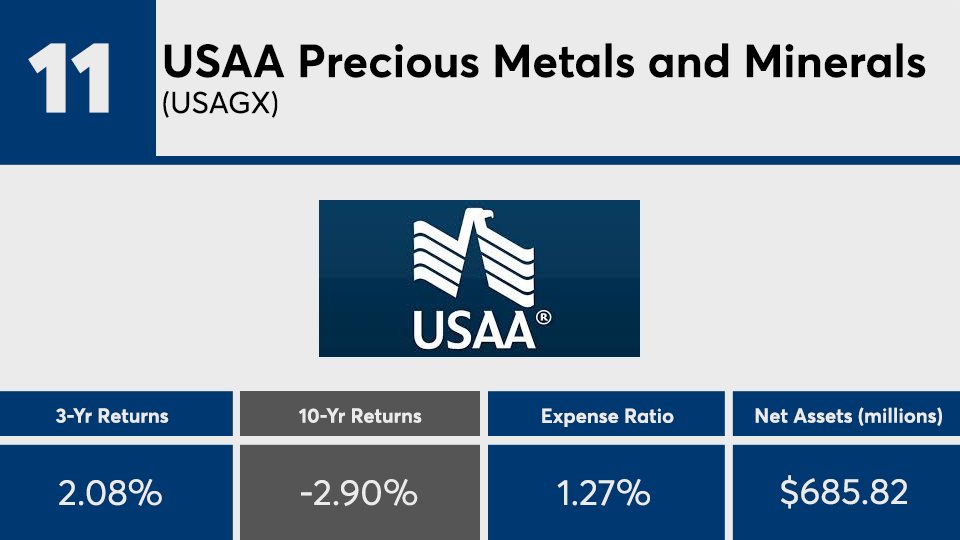
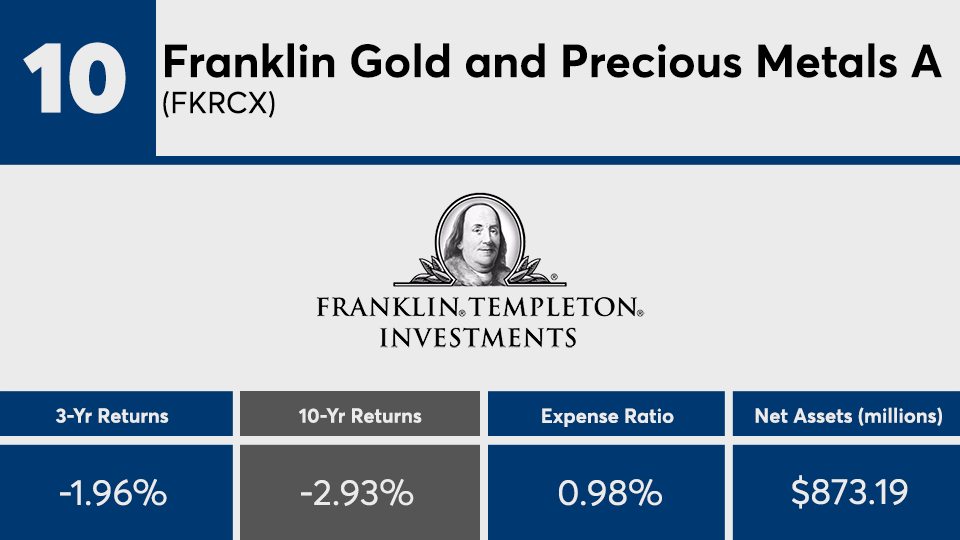
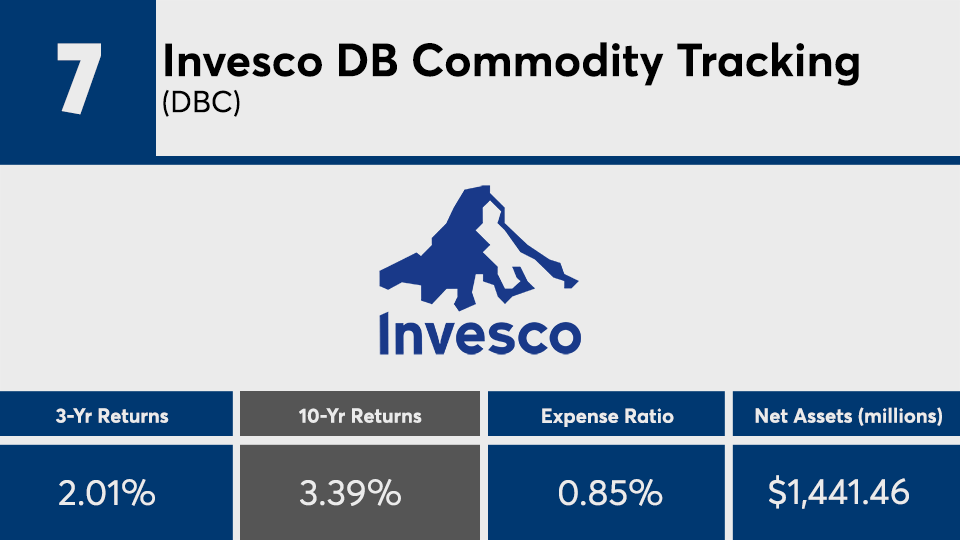
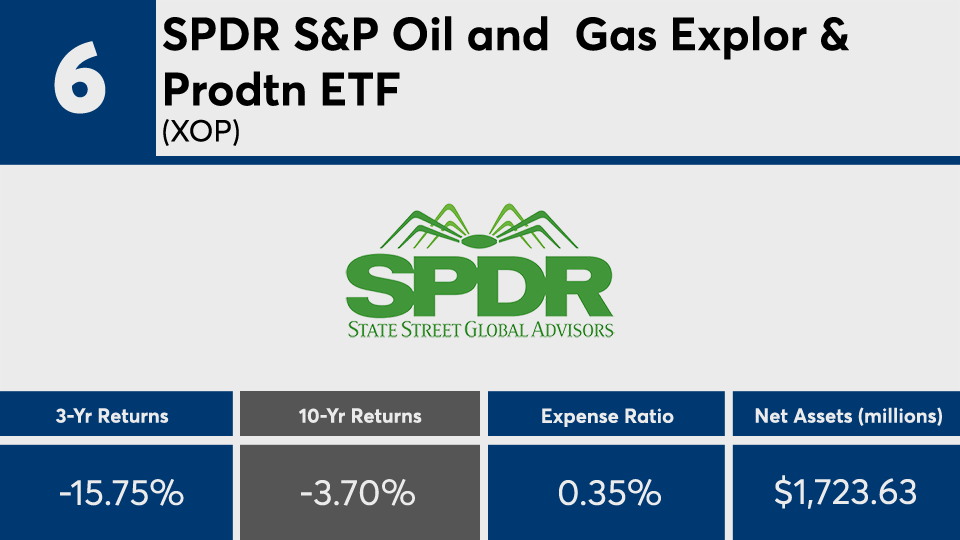
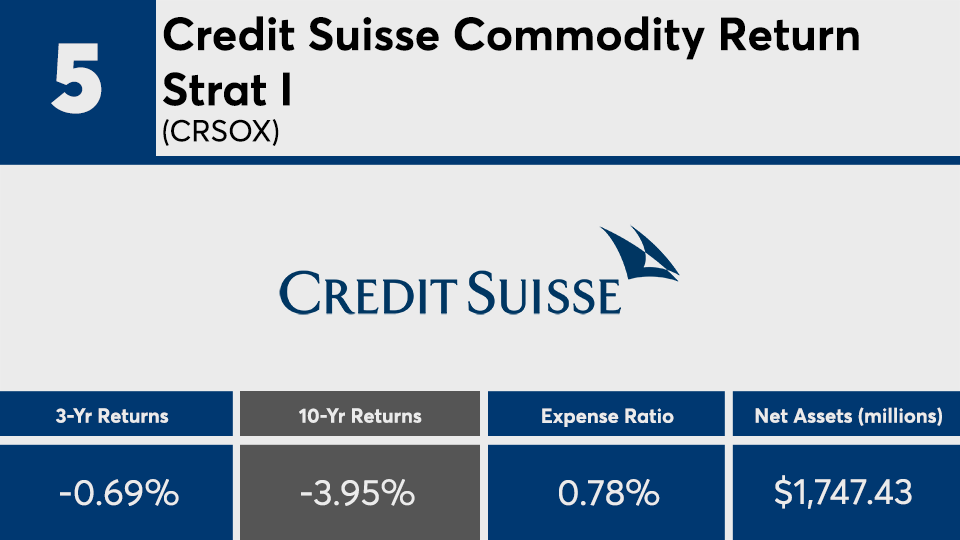
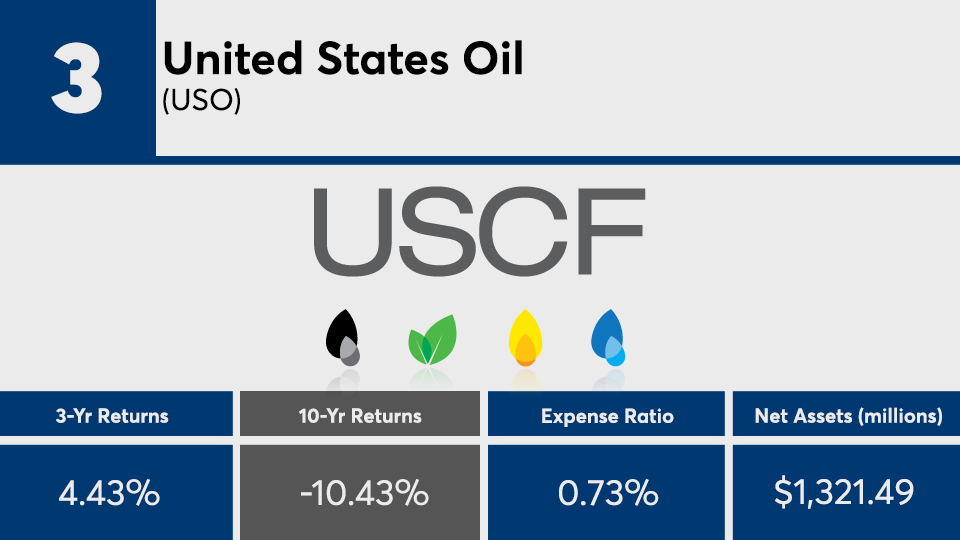
The 20 worst performing funds, which hold nearly $50 billion in assets, have narrow investment strategies, focus on commodities including gold and oil and are concentrated in a narrow geographic segment, according to Morningstar Direct data. The funds experienced an average loss of 3.76% over the last 10 years, although four of them have generated meager returns.
These 20 funds, half of which are mutual funds, have an average expense ratio of 75 basis points — more costly than the typical fund, which has an expense ratio of 0.48%, according to Morningstar’s 2019 annual fee survey.
Narrowly focused investment strategies are “feast or famine” by nature and will likely experience prolonged underperformance, McBride said. They also carry higher expense ratios because of greater turnover and trading in less liquid securities.
“While the higher expense ratios were not the reason for underperformance, higher expenses will be a headwind to outperformance even when fortunes turn for that particular strategy.” he said.
Instead, advisors should encourage their clients to choose a broad-based, diversified investment approach focused on low cost index funds, McBride recommended.
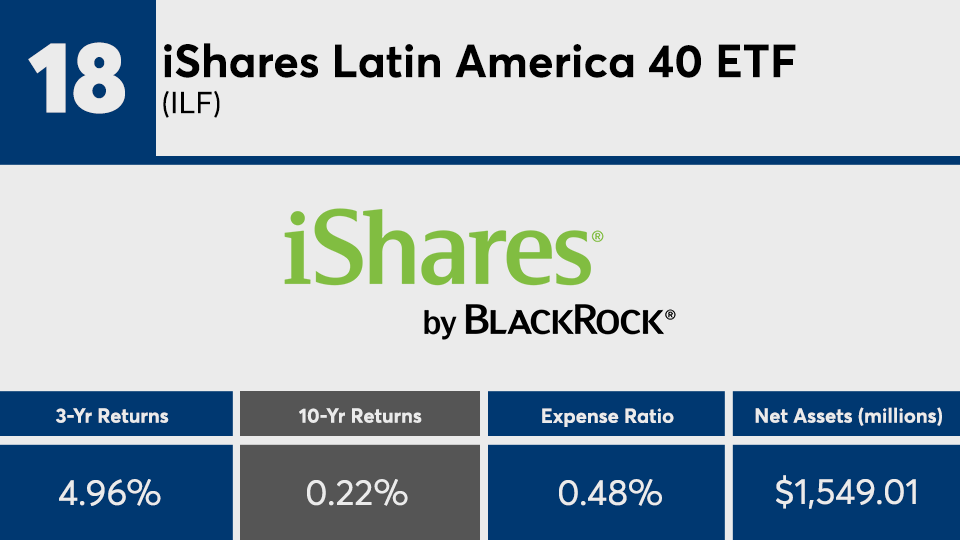
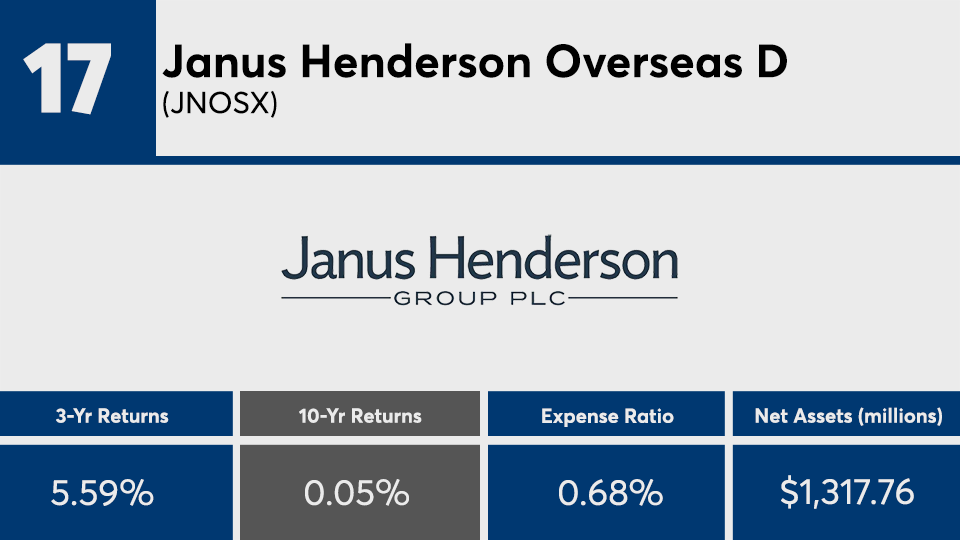
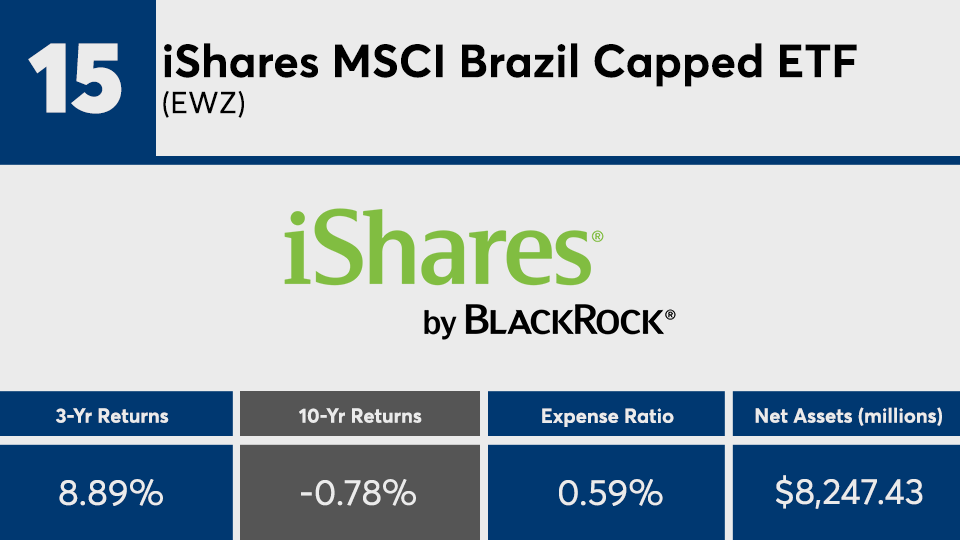
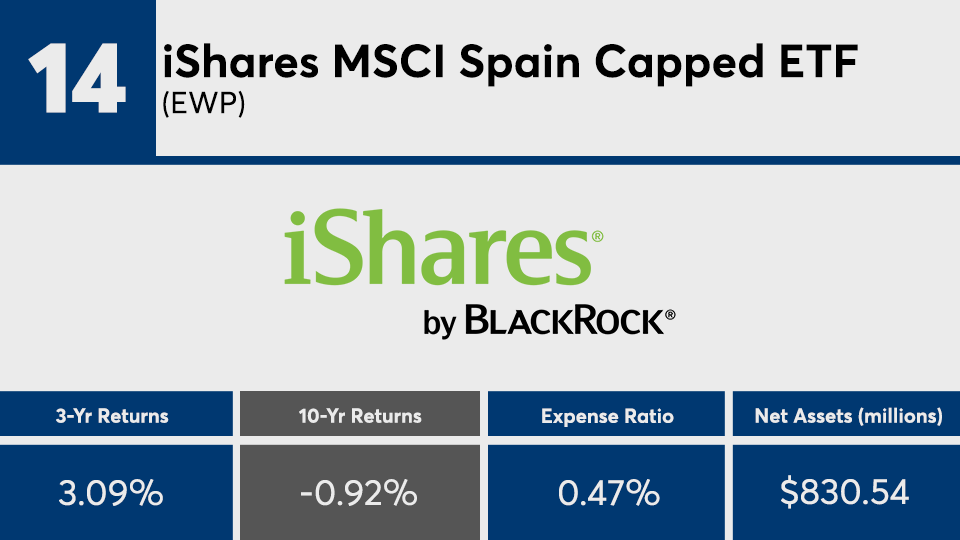
Scroll through to see the 20 worst-performing funds ranked by 10-year annualized returns through Sept. 5. Funds with less than $500 million in AUM and investment minimums over $100,000 were excluded, as were ETNs, leveraged and institutional funds. Assets and expense ratios for each fund, as well as one-year daily returns, are also listed. The data shows each fund's primary share class. All data from Morningstar Direct.


