Vanguard leads mutual fund inflows of the past 15 years

Among the mutual funds with the largest net flows over 15 years, Vanguard isn’t just a leader. It dominates.

Nearly all of the funds in this ranking — 16 of the top 20 — came from Vanguard. For Greg McBride, chief financial analyst at Bankrate, the reason is simple: cost.

“The list is dominated by Vanguard funds as investors and their advisors favor low cost investment options, whether looking at actively managed or passive, equity or bond,” McBride explains.

The 20 mutual funds with the largest net flows over 15 years, and with at least $100 million in assets under management, welcomed a combined $702.6 billion in client cash over the period, Morningstar Direct data show. In the last year, the same funds recorded net outflows of more than $45 billion.

For comparison, ETFs with the biggest net flows recorded inflows of more than $808 billion.

Though many household names remain at the top of the mutual fund industry’s long-term flow leaders, analysis here paints a clear picture of investors’ growing appetite for low-cost investing, notes McBride. “The three funds with the biggest inflows over the past 15 years are all index funds, underscoring the move toward passive investing that has taken place in recent years,” McBride says.

Despite the large amount of netted cash over the period, funds here generated a 15-year return of just 6.75%. In the past year, the same funds averaged a gain of around 38%. When compared with broader index trackers, ETFs such as the SPDR S&P 500 ETF Trust (SPY) and the SPDR Dow Jones Industrial Average ETF (DIA) saw 15-year returns of 9.95% and 10.10%, respectively, data show. In the past 12 months, SPY and DIA have seen gains of 61.61% and 57.83%, respectively.

In bonds, the iShares Core U.S. Aggregate Bond ETF (AGG) had a 15-year return of 4.16% and one-year return of 0.82%.

Pitted against the industry’s largest mutual fund, the $292.2 billion Fidelity 500 Index (FXAIX) recorded a 13.74% gain since it’s inception on May 4, 2011, data show. FXIAX has seen a net inflow of $125.6 billion since its inception.

The mutual funds in this ranking carried fees no higher than 33 basis points. With an average net expense ratio of 0.17%, they were well below the 0.45% investors paid for fund investing in 2019, according to Morningstar’s most recent annual fee survey.

Scroll through to see the 20 mutual funds, with more than $100 million in AUM, and the biggest month-end 15-year net flows through March 1. Assets and average expense ratios, as well as year-to-date, one-, three-, five, 10- and 15-year returns through March 15 are also listed for each. The data show each fund's primary share class. All data is from Morningstar Direct.
FP031521_20 copy.png

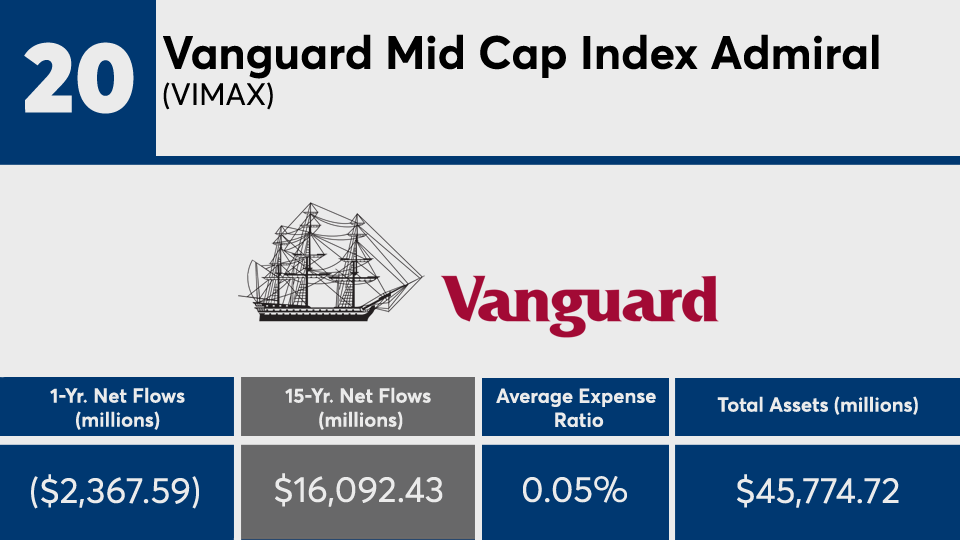
Vanguard Mid Cap Index Admiral (VIMAX)

YTD Return: 7.99%
1-Yr. Return: 73.1%
3-Yr. Annualized Return: 13.43%
5-Yr. Annualized Return: 15.24%
10-Yr. Annualized Return: 12.74%
15-Yr. Annualized Return: 9.95%
YTD Net Flow: (millions): ($134.79)
3-Yr. Net Flow (millions): ($190.06)
5-Yr. Net Flow (millions): $3,586.93
10-Yr. Net Flow (millions): $13,977.69
Minimum Initial Investment: $3,000
Inception Date: Nov. 12, 2001
FP031521_19 copy.png

Vanguard Target Retirement 2035 Investor (VTTHX)

YTD Return: 3.49%
1-Yr. Return: 46.27%
3-Yr. Annualized Return: 9.92%
5-Yr. Annualized Return: 11.99%
10-Yr. Annualized Return: 9.58%
15-Yr. Annualized Return: 7.56%
YTD Net Flow: (millions): ($904.96)
3-Yr. Net Flow (millions): $986.74
5-Yr. Net Flow (millions): $3,564.90
10-Yr. Net Flow (millions): $9,190.52
Minimum Initial Investment: $1,000
Inception Date: Oct. 27, 2003
FP031521_18 copy.png

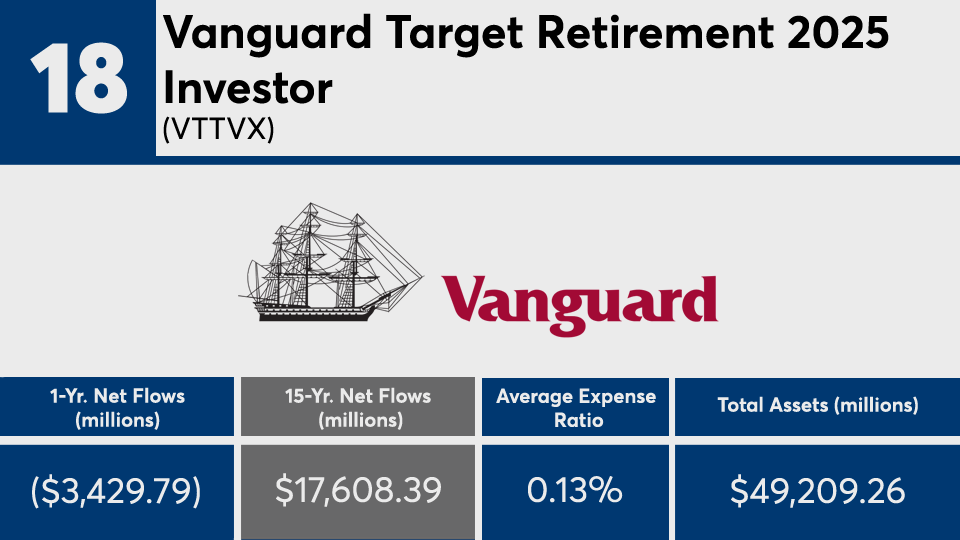
Vanguard Target Retirement 2025 Investor (VTTVX)

YTD Return: 2.14%
1-Yr. Return: 35.85%
3-Yr. Annualized Return: 8.92%
5-Yr. Annualized Return: 10.35%
10-Yr. Annualized Return: 8.52%
15-Yr. Annualized Return: 6.99%
YTD Net Flow: (millions): ($1,072.87)
3-Yr. Net Flow (millions): ($1,987.10)
5-Yr. Net Flow (millions): $599.69
10-Yr. Net Flow (millions): $6,953.39
Minimum Initial Investment: $1,000
Inception Date: Oct. 27, 2003
FP031521_17 copy.png

Vanguard Balanced Index Admiral (VBIAX)

YTD Return: 2.46%
1-Yr. Return: 38.38%
3-Yr. Annualized Return: 11.47%
5-Yr. Annualized Return: 11.78%
10-Yr. Annualized Return: 9.96%
15-Yr. Annualized Return: 8.19%
YTD Net Flow: (millions): $687.39
3-Yr. Net Flow (millions): $6,789.75
5-Yr. Net Flow (millions): $10,411.22
10-Yr. Net Flow (millions): $16,483.33
Minimum Initial Investment: 10,000
Inception Date: Nov. 13, 2000
FP031521_16 copy.png

Vanguard Wellington Admiral (VWENX)

YTD Return: 2.43%
1-Yr. Return: 35.08%
3-Yr. Annualized Return: 10.17%
5-Yr. Annualized Return: 11.27%
10-Yr. Annualized Return: 9.88%
15-Yr. Annualized Return: 8.53%
YTD Net Flow: (millions): ($1,114.22)
3-Yr. Net Flow (millions): ($15,249.20)
5-Yr. Net Flow (millions): ($13,690.55)
10-Yr. Net Flow (millions): $8,108.07
Minimum Initial Investment: $50,000
Inception Date: May 14, 2001
FP031521_15 copy.png

DFA Emerging Markets Core Equity I (DFCEX)

YTD Return: 6.06%
1-Yr. Return: 60.99%
3-Yr. Annualized Return: 4.48%
5-Yr. Annualized Return: 11.95%
10-Yr. Annualized Return: 4.12%
15-Yr. Annualized Return: 6.81%
YTD Net Flow: (millions): ($927.74)
3-Yr. Net Flow (millions): ($2,972.28)
5-Yr. Net Flow (millions): $2,621.55
10-Yr. Net Flow (millions): $15,286.62
Inception Date: April 5, 2005
FP031521_14 copy.png

Vanguard Equity-Income Admiral (VEIRX)

YTD Return: 8.9%
1-Yr. Return: 51.09%
3-Yr. Annualized Return: 9.58%
5-Yr. Annualized Return: 12.15%
10-Yr. Annualized Return: 12.28%
15-Yr. Annualized Return: 9.24%
YTD Net Flow: (millions): $474.03
3-Yr. Net Flow (millions): $4,902.06
5-Yr. Net Flow (millions): $10,133.58
10-Yr. Net Flow (millions): $18,033.76
Minimum Initial Investment: $50,000
Inception Date: Aug. 13, 2001
FP031521_13 copy.png

DFA International Core Equity I (DFIEX)

YTD Return: 6.86%
1-Yr. Return: 66.28%
3-Yr. Annualized Return: 4.67%
5-Yr. Annualized Return: 9.74%
10-Yr. Annualized Return: 5.92%
15-Yr. Annualized Return: 5.09%
YTD Net Flow: (millions): ($96.72)
3-Yr. Net Flow (millions): $420.41
5-Yr. Net Flow (millions): $7,359.69
10-Yr. Net Flow (millions): $15,981.22
Inception Date: Sept. 14, 2005
FP031521_12 copy.png

Vanguard International Growth Admiral (VWILX)

YTD Return: 0.97%
1-Yr. Return: 103.99%
3-Yr. Annualized Return: 19.97%
5-Yr. Annualized Return: 22.86%
10-Yr. Annualized Return: 12.48%
15-Yr. Annualized Return: 9.82%
YTD Net Flow: (millions): $1,326.23
3-Yr. Net Flow (millions): $6,442.51
5-Yr. Net Flow (millions): $11,935.37
10-Yr. Net Flow (millions): $19,033.53
Minimum Initial Investment: $50,000
Inception Date: Aug. 13, 2001
FP031521_11 copy.png

Vanguard Intermediate-Term Investment-Grade Admiral (VFIDX)

YTD Return: -3.27%
1-Yr. Return: 5.6%
3-Yr. Annualized Return: 6.28%
5-Yr. Annualized Return: 4.64%
10-Yr. Annualized Return: 4.6%
15-Yr. Annualized Return: 5.33%
YTD Net Flow: (millions): ($26.35)
3-Yr. Net Flow (millions): $2,866.90
5-Yr. Net Flow (millions): $9,356.21
10-Yr. Net Flow (millions): $17,507.48
Minimum Initial Investment: $50,000
Inception Date: Feb. 12, 2001
FP031521_10 copy.png

Vanguard Wellesley Income Admiral (VWIAX)

YTD Return: 0.54%
1-Yr. Return: 19.53%
3-Yr. Annualized Return: 8%
5-Yr. Annualized Return: 7.72%
10-Yr. Annualized Return: 7.66%
15-Yr. Annualized Return: 7.34%
YTD Net Flow: (millions): ($535.65)
3-Yr. Net Flow (millions): $17.28
5-Yr. Net Flow (millions): $6,681.89
10-Yr. Net Flow (millions): $18,188.59
Minimum Initial Investment: $50,000
Inception Date: May 14, 2001
FP031521_09 copy.png

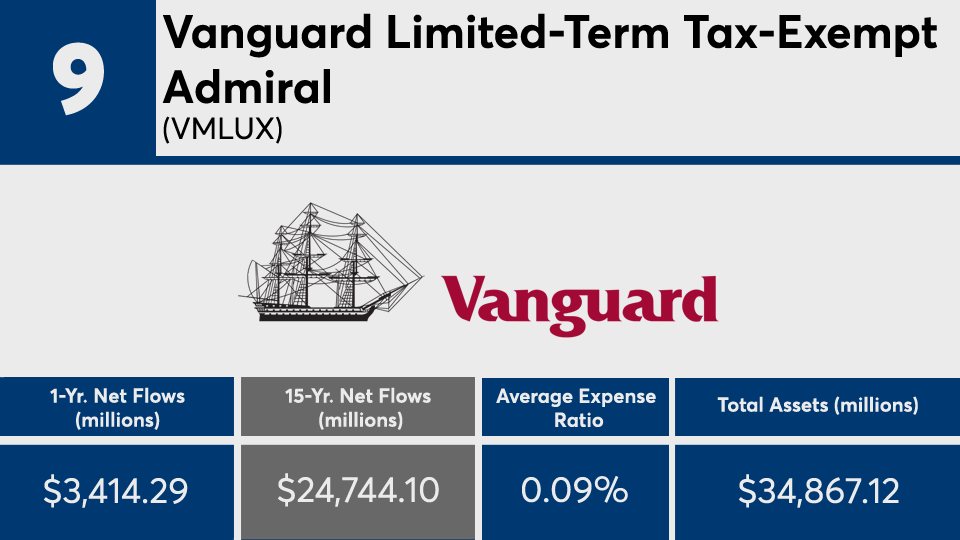
Vanguard Limited-Term Tax-Exempt Admiral (VMLUX)

YTD Return: 0.12%
1-Yr. Return: 4.08%
3-Yr. Annualized Return: 3.12%
5-Yr. Annualized Return: 2.12%
10-Yr. Annualized Return: 2.02%
15-Yr. Annualized Return: 2.59%
YTD Net Flow: (millions): $1,598.30
3-Yr. Net Flow (millions): $7,722.89
5-Yr. Net Flow (millions): $11,648.95
10-Yr. Net Flow (millions): $19,625.37
Minimum Initial Investment: $50,000
Inception Date: Feb. 12, 2001
FP031521_08 copy.png

PGIM Total Return Bond Z (PDBZX)

YTD Return: -4.28%
1-Yr. Return: 2.79%
3-Yr. Annualized Return: 5.21%
5-Yr. Annualized Return: 4.65%
10-Yr. Annualized Return: 4.64%
15-Yr. Annualized Return: 5.59%
YTD Net Flow: (millions): $250.84
3-Yr. Net Flow (millions): $15,857.40
5-Yr. Net Flow (millions): $24,300.86
10-Yr. Net Flow (millions): $30,273.86
Inception Date: Sept. 16, 1996
FP031521_07 copy.png

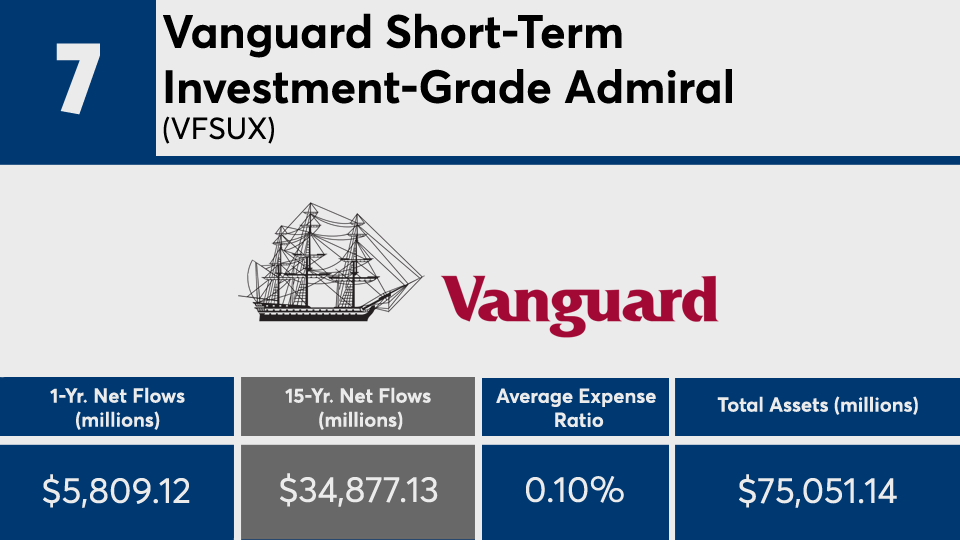
Vanguard Short-Term Investment-Grade Admiral (VFSUX)

YTD Return: -0.45%
1-Yr. Return: 4.34%
3-Yr. Annualized Return: 4.06%
5-Yr. Annualized Return: 3.16%
10-Yr. Annualized Return: 2.62%
15-Yr. Annualized Return: 3.44%
YTD Net Flow: (millions): $1,743.27
3-Yr. Net Flow (millions): $5,363.00
5-Yr. Net Flow (millions): $12,230.01
10-Yr. Net Flow (millions): $22,649.30
Minimum Initial Investment: $50,000
Inception Date: Feb. 12, 2001
FP031521_06 copy.png

Dodge & Cox Income (DODIX)

YTD Return: -2.46%
1-Yr. Return: 7.07%
3-Yr. Annualized Return: 5.7%
5-Yr. Annualized Return: 5.02%
10-Yr. Annualized Return: 4.25%
15-Yr. Annualized Return: 5.07%
YTD Net Flow: (millions): $751.62
3-Yr. Net Flow (millions): $4,284.44
5-Yr. Net Flow (millions): $12,746.68
10-Yr. Net Flow (millions): $30,252.18
Minimum Initial Investment: $2,500
Inception Date: Jan. 3, 1989
FP031521_05 copy.png

Vanguard Total Stock Market Index Admiral (VTSAX)

YTD Return: 6.52%
1-Yr. Return: 69.23%
3-Yr. Annualized Return: 15.23%
5-Yr. Annualized Return: 17.14%
10-Yr. Annualized Return: 14.05%
15-Yr. Annualized Return: 10.3%
YTD Net Flow: (millions): ($640.08)
3-Yr. Net Flow (millions): ($13,626.78)
5-Yr. Net Flow (millions): ($504.27)
10-Yr. Net Flow (millions): $31,174.87
Minimum Initial Investment: $3,000
Inception Date: Nov. 13, 2000
FP031521_04 copy.png

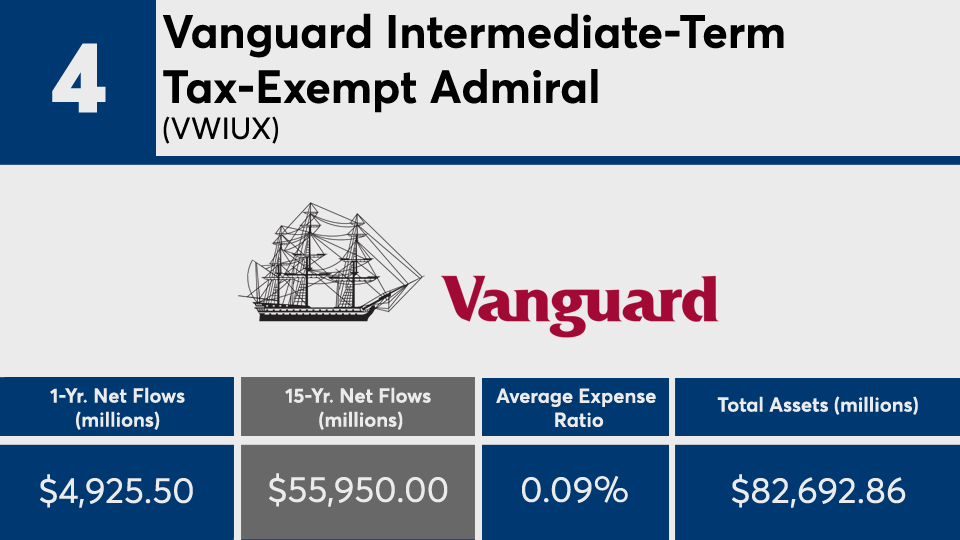
Vanguard Intermediate-Term Tax-Exempt Admiral (VWIUX)

YTD Return: -0.22%
1-Yr. Return: 6.17%
3-Yr. Annualized Return: 4.85%
5-Yr. Annualized Return: 3.4%
10-Yr. Annualized Return: 4.08%
15-Yr. Annualized Return: 4.11%
YTD Net Flow: (millions): $1,592.03
3-Yr. Net Flow (millions): $18,667.75
5-Yr. Net Flow (millions): $28,442.91
10-Yr. Net Flow (millions): $44,969.76
Minimum Initial Investment: $50,000
Inception Date: Feb. 12, 2001
FP031521_03 copy.png

Vanguard 500 Index Admiral (VFIAX)

YTD Return: 5.33%
1-Yr. Return: 61.74%
3-Yr. Annualized Return: 14.45%
5-Yr. Annualized Return: 16.52%
10-Yr. Annualized Return: 13.98%
15-Yr. Annualized Return: 10.02%
YTD Net Flow: (millions): ($2,504.04)
3-Yr. Net Flow (millions): $915.85
5-Yr. Net Flow (millions): $24,848.87
10-Yr. Net Flow (millions): $60,419.17
Minimum Initial Investment: $3,000
Inception Date: Nov. 13, 2000
FP031521_02 copy.png

Vanguard Total Bond Market Index Admiral (VBTLX)

YTD Return: -3.5%
1-Yr. Return: 1.24%
3-Yr. Annualized Return: 4.89%
5-Yr. Annualized Return: 3.38%
10-Yr. Annualized Return: 3.37%
15-Yr. Annualized Return: 4.26%
YTD Net Flow: (millions): $773.88
3-Yr. Net Flow (millions): $21,206.89
5-Yr. Net Flow (millions): $40,110.56
10-Yr. Net Flow (millions): $65,807.11
Minimum Initial Investment: $3,000
Inception Date: Nov. 12, 2001
FP031521_01 copy.png

Vanguard Total International Stock Index Investor (VGTSX)

YTD Return: 4.79%
1-Yr. Return: 59.43%
3-Yr. Annualized Return: 5.99%
5-Yr. Annualized Return: 10.32%
10-Yr. Annualized Return: 5.47%
15-Yr. Annualized Return: 4.8%
YTD Net Flow: (millions): ($4,645.94)
3-Yr. Net Flow (millions): $24,902.48
5-Yr. Net Flow (millions): $39,901.30
10-Yr. Net Flow (millions): $80,734.05
Minimum Initial Investment: $3,000
Inception Date: April 29, 1996
MORE FROM FINANCIAL PLANNING