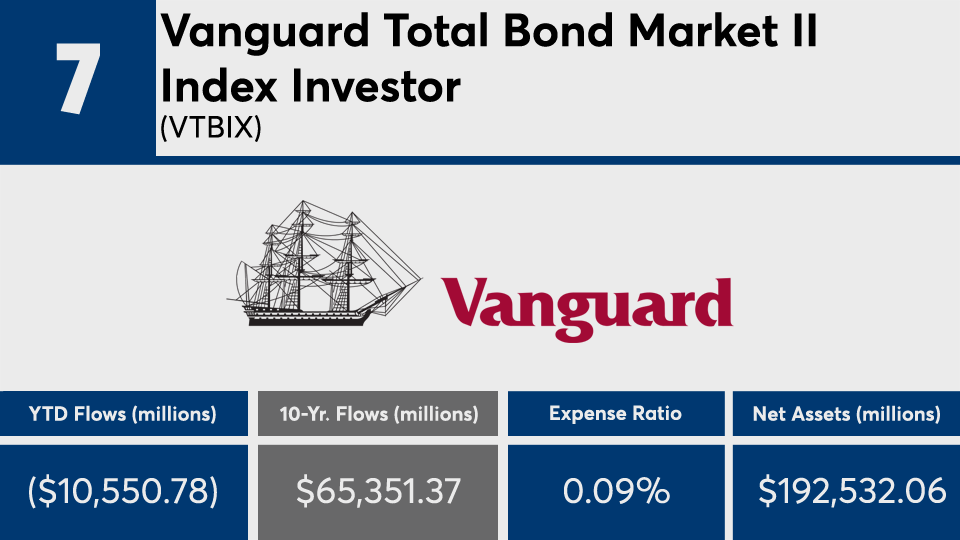
Index funds with the biggest net flows of the decade reported losses this year as the coronavirus left no segment of the industry unscathed.
With nearly $2.8 trillion in combined assets, the 20 U.S. index funds with the biggest net inflows over 10 years through July 1 raked in a combined $949 billion during that time period, Morningstar Direct data show. In the first six months of 2020, the funds reported a net inflow of $12.1 billion. The same funds also reported a YTD loss of nearly 3%.
Over the long term, the top 20 underperformed the broader industry. With an average 10-year gain of nearly 9%, the funds came in shy of index trackers like the SPDR S&P 500 ETF Trust (SPY) and the SPDR Dow Jones Industrial Average ETF Tracker (DIA), which posted 10-year gains of 14.07% and 13.12%, respectively. Year-to-date, the leaders had an average loss of 2.86%. SPY and DIA, meanwhile, recorded losses of 2.07% and 8.34%, respectively.
On the fixed income side, the iShares Core US Aggregate Bond ETF (AGG) recorded a 10-year and YTD gains of 3.75% and 6.20%, data show.
As expected, fees among index funds with the biggest net flows were nearly zero. With an average net expense ratio of 0.09%, the funds — 13 of which belong to Vanguard — were nearly 40 basis points cheaper than the broader fund industry’s average of 0.45%, according to Morningstar’s most recent annual fee survey.
“Investors are the beneficiary of the lower expense ratio,” says Marc Pfeffer, CIO of CLS Investments.
Pfeffer adds that advisors must always stress the bigger picture to their clients. “Fees are just one component and there are plenty of very good active funds that will beat passive. There’s a place for both, as we’ve seen, so I wouldn’t just take one strategy and abandon the other,” he says.
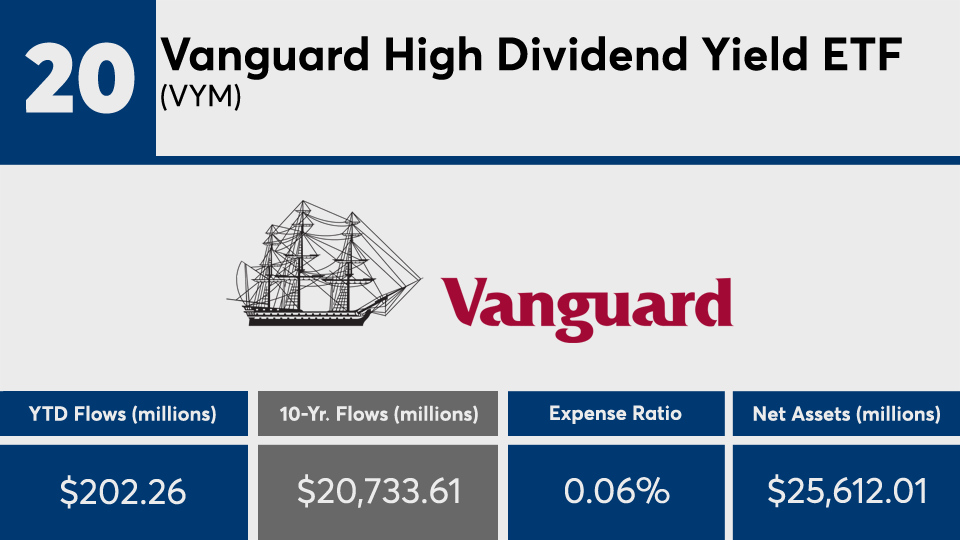
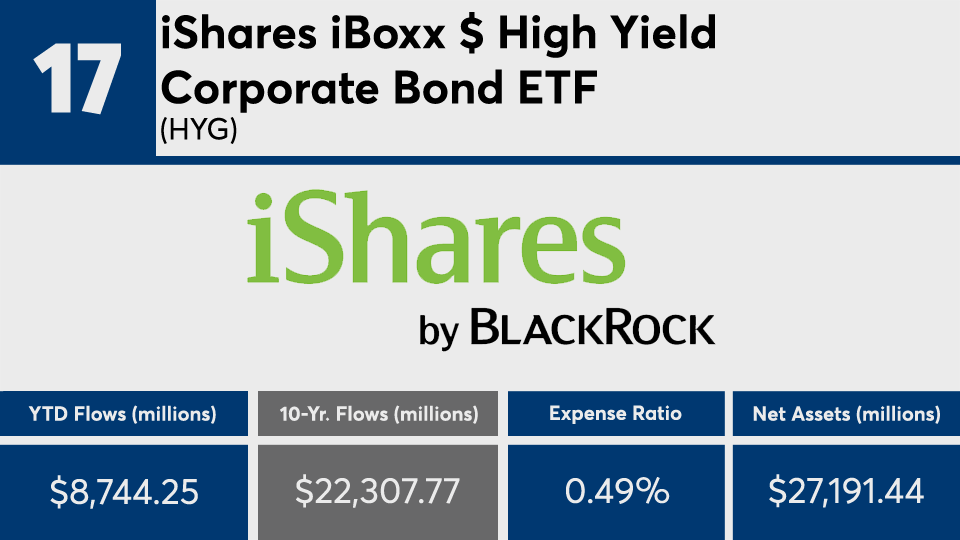
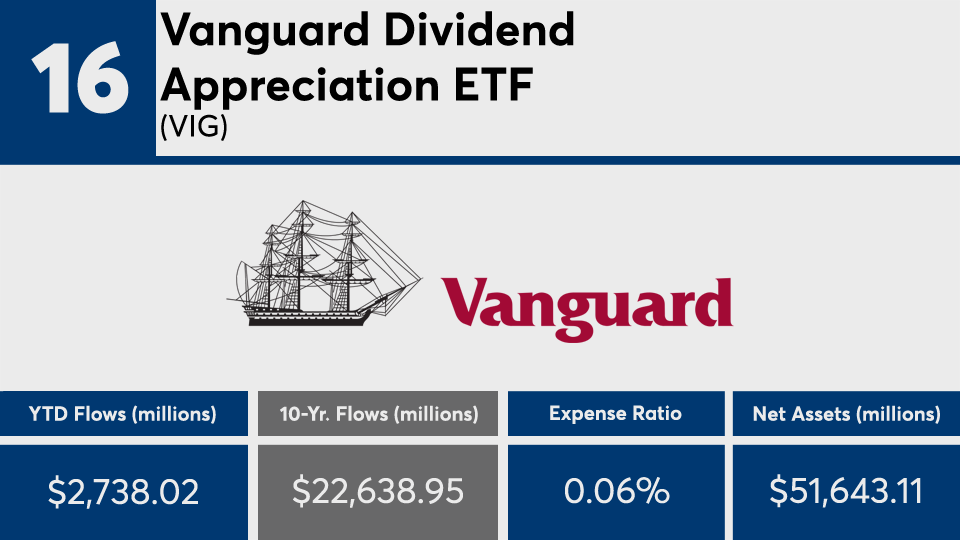
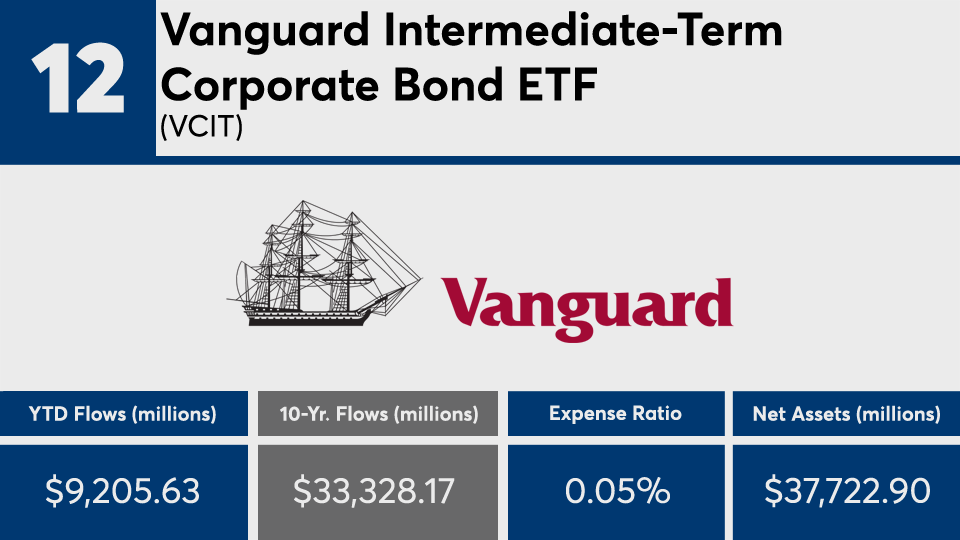
Scroll through to see the 20 index funds with the largest 10-year net flows through July 1. Funds with less than $500 million in AUM and with investment minimums over $100,000 were excluded, as were leveraged and institutional funds. Assets and expense ratios, as well as year-to-date and one-, three-, five- and 10-year returns and net flows are listed for each. Returns are through July 5. The data show each fund's primary share class. All data is from Morningstar Direct.

