With rock-bottom fees at the forefront of what clients desire for fund investing these days, it’s no surprise to many advisors that the industry's most popular index funds added nearly half of their AUM over the last three years, data show.
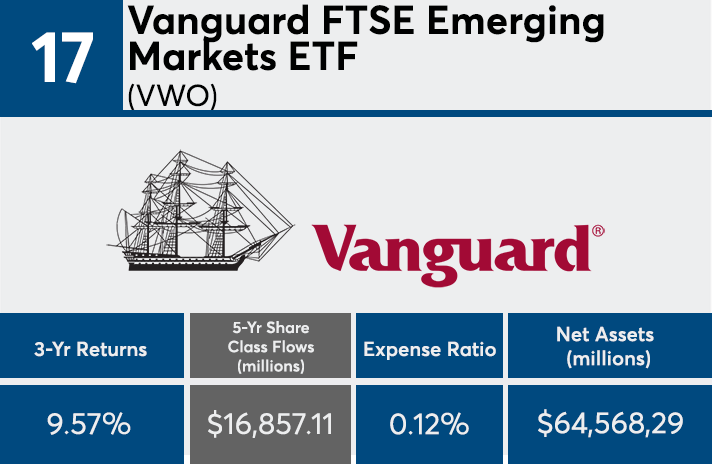
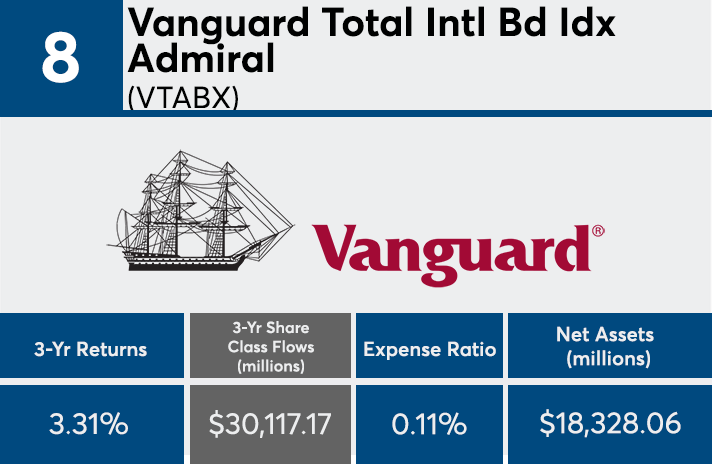
The 20 index funds with the largest net inflows (with at least $500 million in AUM) raked in a combined $626 billion, Morningstar Direct data show. Those funds, nearly all of which are ETFs, hold a combined $1.4 trillion. The massive money movement highlights the larger trend toward low-cost, passive investing, as well as the growth of ETFs, says Greg McBride, chief analyst at Bankrate.
With an average expense ratio of 0.07%, these funds are nearly 40 basis points cheaper than the 0.48% investors paid for fund investing on average last year, according to Morningstar’s most recent annual fee survey, which reviewed the asset-weighted average expense ratios of all U.S. open-end mutual funds and ETFs. With $814 billion in AUM, the industry’s largest index tracker, the Vanguard Total Stock Market Index Fund Admiral Shares (VTSAX), has an expense ratio of 0.04% and net three-year inflows of $19.4 billion, data show.
“It is comforting that the biggest fund and ETF inflows in the past three years are into low cost, broad-based index funds, both stocks and bonds, and not chasing niche, flavor-of-the-month investment strategies,” McBride said. “Investors will be well-served over the long term by adhering to this discipline.”
For advisors with clients on the hunt for low-cost vehicles to park their retirement savings, McBride warns what works now may not have the same results even in the short term. “It is easy to invest in a rising market, but will we see the same level of inflows, or any net inflows at all, in an extended market downturn? Advisors need to stress to their clients the importance of buying low, when fear is highest and valuations are attractive, in order to get the growth needed for a sufficient retirement nest egg,” McBride explained.
Scroll through to see the 20 index funds ranked by their estimated share class net inflows through the end of June. Funds with less than $500 million in AUM and investment minimums over $100,000 were excluded, as were ETNs, leveraged and institutional funds. Assets and expense ratios for each fund, as well as three-year daily returns through July 1, are also listed. The data is based on each fund's primary share class.


