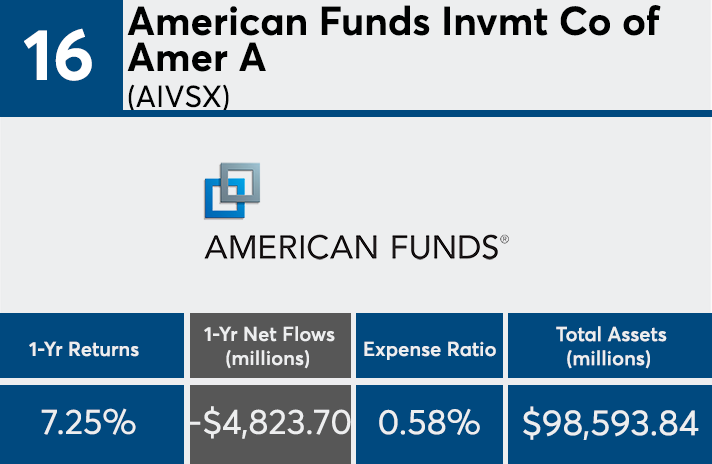
The industry’s largest 20 mutual funds and ETFs account for $3.96 trillion in client assets. In the last year, just five reported net inflows. Those with outflows — in some cases — reported outflows of well over $5 billion.
Why have so many fallen out of favor?
Last year, the asset-weighted average expense ratio across index mutual funds and ETFs was 0.52%, an 8% decline from 2016, according to Morningstar. While the five funds on our list with net inflows over the past year had an average expense ratio of 0.19%, it should be no surprise that the 15 with net outflows posted a much higher average expense ratio: 0.40%, says Greg McBride, chief financial analyst at Bankrate.
“The top four in inflows are all index mutual funds and ETFs, underscoring investors’ preference for low-cost, passive investing at the expense of costlier active management,” McBride says.
Although just a quarter of the largest funds attracted more client money than they lost, these products managed to rake in a combined $4.9 billion, according to Morningstar Direct. Despite the significant outflows, 14 had positive returns, at an average of 4.56%. In addition to having lower fees, McBride says diversification and individual strategies are what drive performance.
“The top three seeing inflows represent a fairly well-diversified portfolio — a total international stock index, the S&P 500 and total bond market index,” McBride says. “With the top inflows going to an international stock index, it’s a testament to investors’ desire for value rather than chasing performance.”
With $3.23 trillion in combined assets, it should be noted that funds from Vanguard and American Funds dominated the list, with international offerings attracted the investor cash.
For advisors looking for reasons why these funds have seemingly fallen out of favor, aside from their costs, McBride says popping the hood to analyze their individual prospectuses is one place to start.
“It pays to look at each fund specifically,” he says. “If the manager changed, if the particular investment style fell out of favor, or if it had a poor period of performance, each could be a catalyst for large outflows.”
Scroll through to see the five funds with inflows and 15 with outflows over the last year. Leveraged and institutional funds are excluded from this list. We also show one-year returns, assets and expense ratios. All data from Morningstar Direct.


