While more than 80 asset managers offer exchange-traded products in the U.S., BlackRock, State Street and Vanguard dominate the industry. Those three firms account for half of the top-performing passive funds since the financial crisis, not to mention 82% of all industry assets, according to Bloomberg News.
“The last 10 years has seen the market move from the trough to a new record high,” notes Greg McBride, chief financial analyst at Bankrate.com. “A lot of the best performers were the hardest hit as the economy was unwinding, so you might see some high growth in funds that really took it on the chin as the crisis was unfolding.”
A majority of the decade’s top-performers are in technology and health care. Passive funds feed off the performance of their respective sectors, notes McBride as one reason for their success over the long-term. All told, passive funds have grown to $6.9 trillion, compared to roughly $11.4 trillion for active products, according to Morningstar
“Returns on passive funds are a byproduct of the performance of the market of sector it is designed to mimic and the expense ratio,” McBride says. “It has never been easier for an individual investor to put money to work without the headwind of commissions and other expenses. The price war among the top brokerages and mutual fund families is directly befitting the investor.”
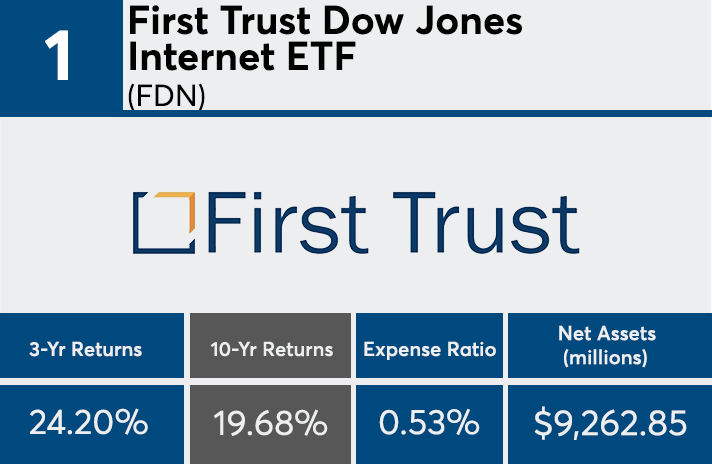
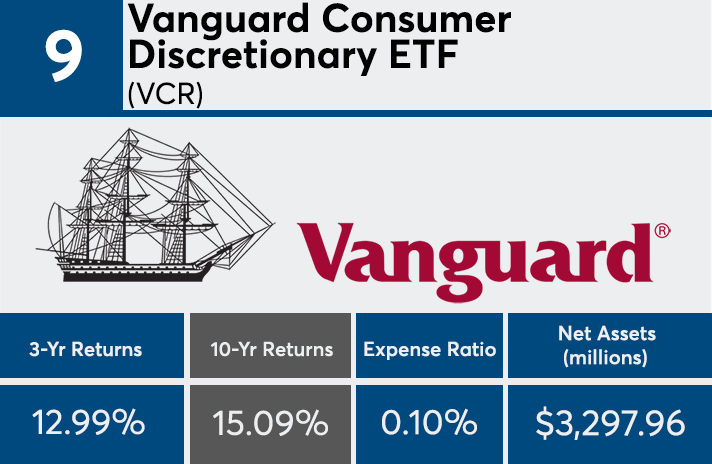
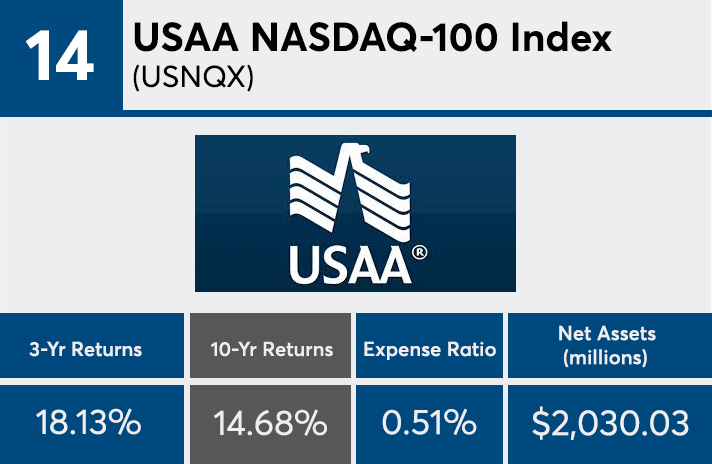
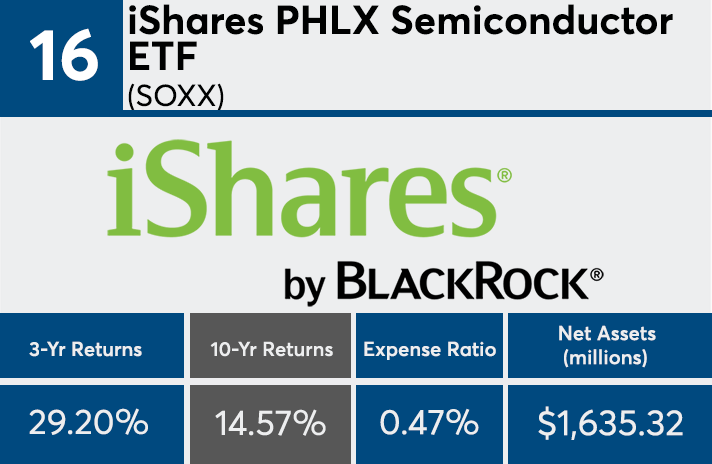
With fees ranging from 10 to 53 basis points, the average expense ratio among the top 20 funds came in at 0.43%, nearly half the price of actively managed equity mutual funds, which fell to 0.78% in 2017 from 0.82% in 2016, according to the Investment Company Institute.
“Lower fees translate into higher net of fee returns because the cost savings flow right into investors pockets,” explains Alex Bryan, director of passive strategies research for Morningstar in North America. “Fees are one of the best predictors of performance (cheaper funds tend to do better).”
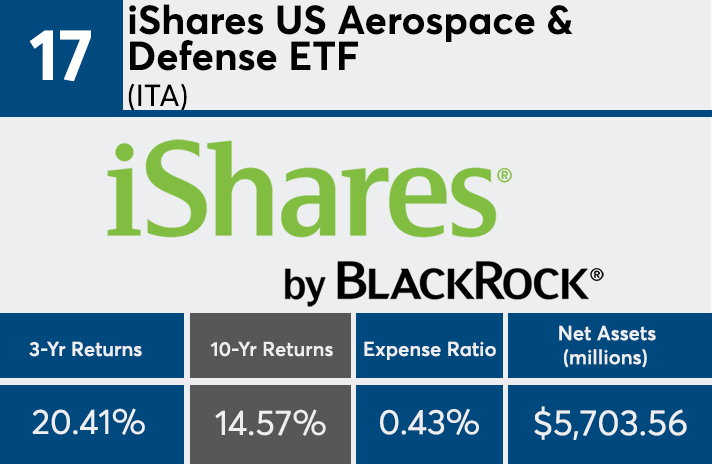
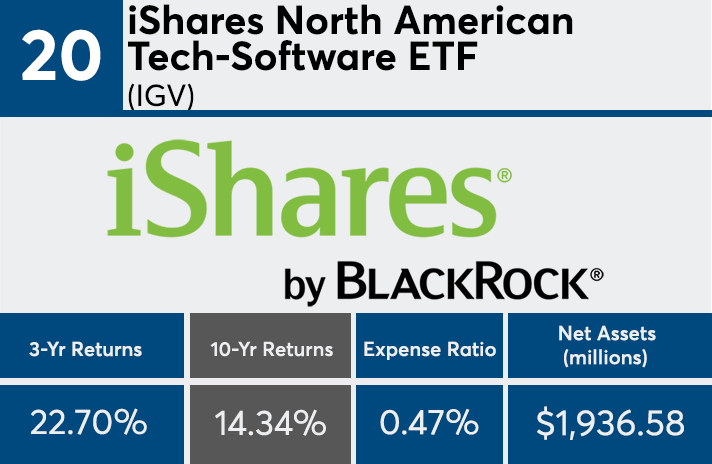
Scroll through to see the 20 passively managed funds with the best returns over the past decade. Daily return figures are as of Aug. 17. Funds with less than $250 million in client assets and investment minimums over $100,000 were excluded, as were leveraged and institutional funds. We also show three-year returns, assets and expense ratios for each fund. All data from Morningstar Direct.
