FP50 2018: Which IBDs made the most in annuity sales?

The largest independent broker-dealers’ combined annuity sales have fallen each of the past three years, but the products still make up nearly one-sixth of their business.

Total annuities revenue across the 50 largest IBDs participating in Financial Planning’s annual FP50 survey of the industry dropped 10% last year to $4.4 billion. The products constituted 17% of their more than $25.7 billion in revenue, down from 21% in 2014 but still a higher share than any other product.

The lower sales reflect an industrywide slump, albeit with a different mix of variable and fixed contracts than seen throughout the broader financial services. Overall, sales of annuities slipped 8% in 2017 to $204 billion, a three-year low, according to the LIMRA Secure Retirement Institute.

The now-vacated fiduciary rule had prompted issuers and IBDs to alter their sales practices and modify products to comply with the enhanced scrutiny on retirement accounts. After the rule’s demise earlier this year, though, LIMRA boosted its forecast for sales in 2018, expecting a rise of 5% to 10%.

Last year, nearly three quarters of annuity purchases by clients of the largest IBDs were variable contracts in 2017, amounting to nearly $3.2 billion in revenue. In the overall market, fixed sales outpaced variable sales in 2016 by $12 billion and maintained the same margin last year.

Eight of the 10 IBDs reporting the largest revenues from annuities for the year also made last year’s list, and one firm alone — LPL Financial — again disclosed nearly double the annuity sales of any other IBD. Overall, only three of the top 10 firms took in lower annuity revenue in 2017, compared to eight of the top 10 in 2016.

Major IBD network Advisor Group and No. 6 IBD Northwestern Mutual didn’t provide their sales figures. Additionally, firms showed wide variation in the range and specificity of their responses to the survey with respect to their payouts to advisors on the sales commissions from the products.

To see the list of the top 10 firms ranked by annuity revenue, scroll though our slideshow. For a list of the top 10 IBDs ranked by fastest-growing payouts, click here. To view a full recap of the last year in the IBD space, see FP50 2018: Independent broker-dealers adapt to survive.

FP502018_annuitiesrev_No1 copy.png

LPL Financial

Variable annuities revenue: $712,673,000
Fixed annuities revenue: $141,290,000
Annuities revenue, 2017: $853,963,000
% change year-over-year: (7.0%)
% of total revenue: 20%
Annuity payout for advisors: 90% to 98%
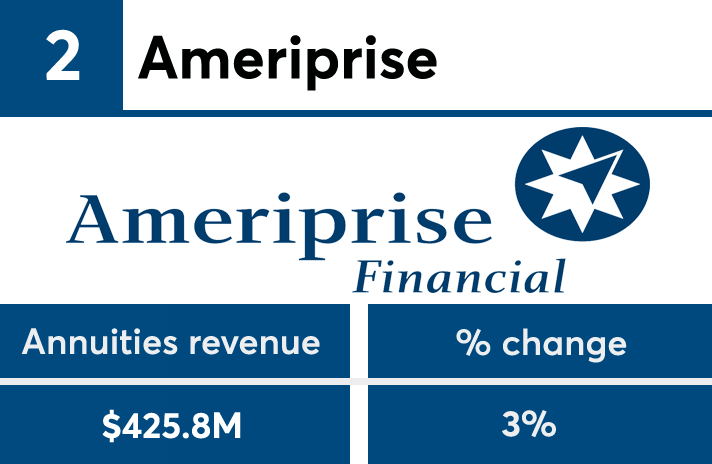
FP502018_annuitiesrev_No2 copy.png

Ameriprise Financial

Variable annuities revenue: Not available
Fixed annuities revenue: Not available
Annuities revenue, 2017: $425,804,000
% change year-over-year: 2.9%
% of total revenue: 10%
Annuity payout for advisors: up to 91%
FP502018_annuitiesrev_No3 copy.png

MML Investors Services

Variable annuities revenue: $415,404,000
Fixed annuities revenue: $425,000
Annuities revenue, 2017: $415,829,000
% change year-over-year: 215.5%
% of total revenue: 40%
Annuity payout for advisors: 40% to 82.5%
FP502018_annuitiesrev_No4 copy.png

AXA Advisors

Variable annuities revenue: $373,021,000
Fixed annuities revenue: Not available
Annuities revenue, 2017: $373,021,000
% change year-over-year: 0.5%
% of total revenue: 47%
Annuity payout for advisors: 55% to 90%
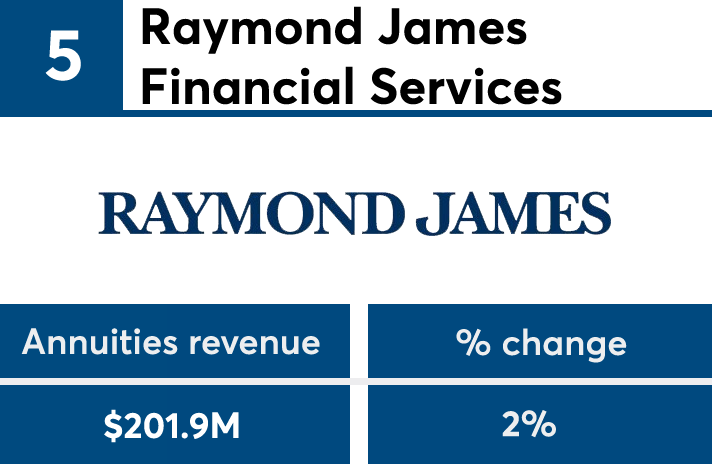
FP502018_annuitiesrev_No5 copy.png

Raymond James Financial Services

Variable annuities revenue: $166,565,000
Fixed annuities revenue: $35,382,000
Annuities revenue, 2017: $201,948,000
% change year-over-year: 2.0%
% of total revenue: 10%
Annuity payout for advisors: Amount "based on overall production schedule," according to the company
FP502018_annuitiesrev_No6 copy.png

Lincoln Financial Network

Variable annuities revenue: $152,466,000
Fixed annuities revenue: $17,673,000
Annuities revenue, 2017: $170,139,000
% change year-over-year: (3.6%)
% of total revenue: 23%
Annuity payout for advisors: Not available
FP502018_annuitiesrev_No7 copy.png

Voya Financial Advisors

Variable annuities revenue: $137,444,000
Fixed annuities revenue: $12,853,000
Annuities revenue, 2017: $150.298,000
% change year-over-year: 5.6%
% of total revenue: 35%
Annuity payout for advisors: 92%
FP502018_annuitiesrev_No8 copy.png

Cambridge Investment Research

Variable annuities revenue: $106,712,000
Fixed annuities revenue: $1,406,000
Annuities revenue, 2017: $141,004,000
% change year-over-year: 11.2%
% of total revenue: 17%
Annuity payout for advisors: up to 100%
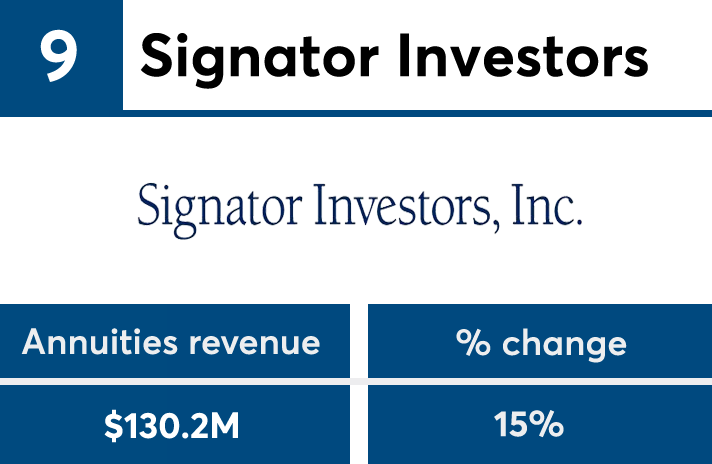
FP502018_annuitiesrev_No9 copy.png

Signator Investors

Variable annuities revenue: $130,224,000
Fixed annuities revenue: Not available
Annuities revenue, 2017: $130,224,000
% change year-over-year: 15.1%
% of total revenue: 19%
Annuity payout for advisors: 91% to 94%
FP502018_annuitiesrev_No10 copy.png

Cetera Advisor Networks

Variable annuities revenue: Not available
Fixed annuities revenue: Not available
Annuities revenue, 2017: $116,417,000
% change year-over-year: (5.0%)
% of total revenue: 19%
Annuity payout for advisors: Amount "set by OSJ," according to the company
MORE FROM FINANCIAL PLANNING