Slideshow

FP50 2018: Which IBDs produce the most fee-based revenue?

The move to fee-based services from commissions amounts to a philosophical change in wealth management, where firms refer to a “secular shift” allowing them to be “agnostic” about products.

Many independent broker-dealers might then be said to be losing their religion.

Some firms embraced planning earlier than their peers, however, and they’re enjoying the benefits of that approach today.

Fee-based revenue surpassed commissions last year for the first time in Financial Planning’s 33rd annual FP50 survey of the largest IBDs. A decade earlier, in 2007, they made $5.9 billion more from commissions than advisory fees. By 2017, though, fees brought in $112.2 million more than commissions at the top 50 IBDs.

All told, commission-based revenue has increased more than 20% to $10.9 billion over the past decade, while fee-based revenue has more than tripled to a little more than $11 billion. Old-time religion is losing out to agnosticism amid the bull returns in equity markets and the lure of recurring revenue.

Despite the new milestone, the list of the top 10 firms according to fee-based revenue remained largely the same from the prior year. The only new members of the group were Kestra Financial and MassMutual’s MML Investors Services, which absorbed MetLife’s Premier Client Group in 2017.

Each of the top 10 firms boosted their fee-based business by double-digit percentages, except for LPL Financial’s near-miss at 9% growth. LPL’s advisory revenue also stands out as a key area where the No. 1 IBD’s closest rival, Ameriprise, is giving it a tougher fight than it’s had for years over the designation of the largest firm in the space.

The No. 2 firm reduced its gap on LPL in overall revenue to $21.5 million in 2017, compared to a $32 million difference in the previous year.

Ameriprise’s fee-based revenue first jumped ahead of LPL’s in 2014, which LPL has attributed to the fact that its hybrid RIA channel doesn’t count toward its advisory revenue. LPL does include such fees in its overall revenue, and its significant lead in commission revenue added up to nearly $471 million last year.

To view the list of the top 10 IBDs ranked by fee-based revenue, scroll through the slideshow. All figures included for the top 10 firms' businesses include their full-year revenue for 2017.

For a ranking of the top 10 IBDs by fee-based mix of business, click here. And to view a full recap of the previous year in the IBD space, see: FP50 2018: Independent Broker-Dealers Adapt to Survive.

FP502018_FeeRev_Median copy.png

FP50 median

2017 median fee revenue: $220,174,000
% change year-over-year: 19.1%
Median commission revenue: $252,035,000
Median other revenue: $65,820,000
Median total revenue: $545,355,000
FP502018_FeeRev_No10 copy.png

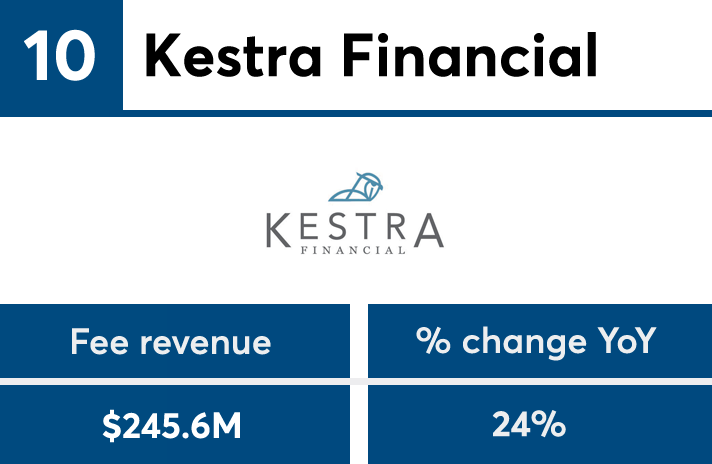
10. Kestra Financial

Fee revenue: $245,563,000
% change year-over-year: 24.2%
Fee revenue rank: #10
Commission revenue: $187,624,000
Other revenue: $42,231,000
Total revenue: $475,418,000
FP50 rank: #14
2016 fee revenue: $197,755,000
2016 fee revenue rank: #11
FP502018_FeeRev_No9 copy.png

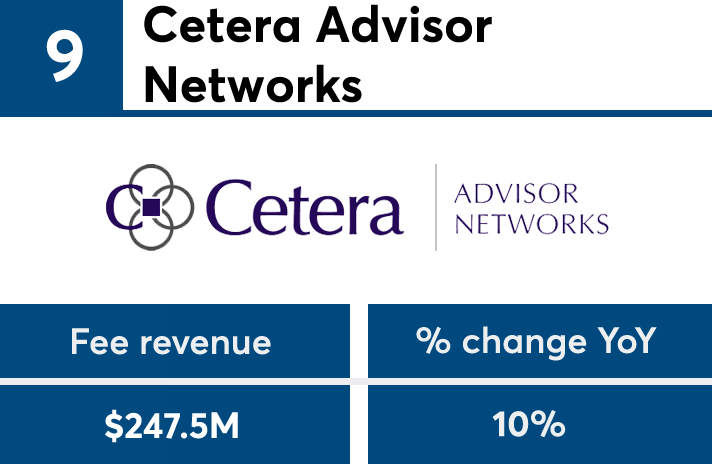
9. Cetera Advisor Networks

Fee revenue: $247,512,000
% change year-over-year: 9.7%
Fee revenue rank: #9
Commission revenue: $274,097,000
Other revenue: $85,240,000
Total revenue: $606,849,000
FP50 rank: #11
2016 fee revenue: $210,256,000
2016 fee revenue rank: #10
FP502018_FeeRev_No8 copy.png

8. Securities America

Fee revenue: $312,100,000
% change year-over-year: 25.6%
Fee revenue rank: #8
Commission revenue: $258,200,000
Other revenue: $67,000,000
Total revenue: $637,300,000
FP50 rank: #10
2016 fee revenue: $248,500,000
2016 fee revenue rank: #7
FP502018_FeeRev_No7 copy.png

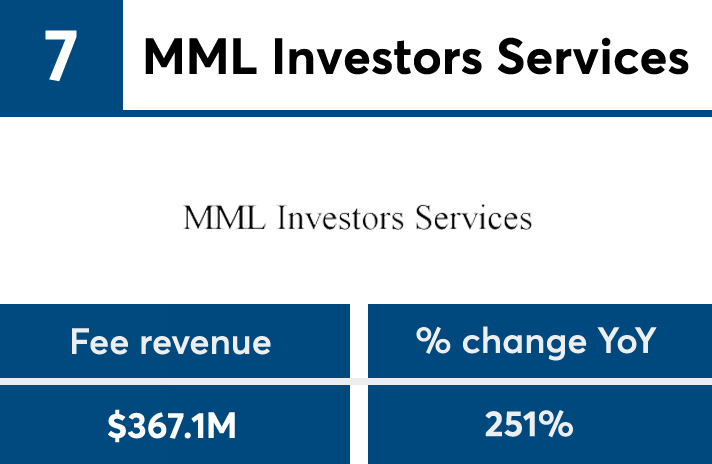
7. MML Investors Services

Fee revenue: $367,113,000
% change year-over-year: 250.9%
Fee revenue rank: #7
Commission revenue: $669,472,000
Other revenue: $13,792,000
Total revenue: $1,050,377,000
FP50 rank: #5
2016 fee revenue: $96,664,000
2016 fee revenue rank: #22
FP502018_FeeRev_No6 copy.png

6. Cambridge Investment Research

Fee revenue: $459,797,000
% change year-over-year: 18.4%
Fee revenue rank: #6
Commission revenue: $259,820,000
Other revenue: $91,779,000
Total revenue: $811,396,000
FP50 rank: #7
2016 fee revenue: $388,319,000
2016 fee revenue rank: #6
FP502018_FeeRev_No5 copy.png

5. Northwestern Mutual

Fee revenue: $628,450,000
% change year-over-year: 26.1%
Fee revenue rank: #5
Commission revenue: $225,865,000
Other revenue: $91,097,000
Total revenue: $945,412,000
FP50 rank: #6
2016 fee revenue: $498,398,000
2016 fee revenue rank: #5
FP502018_FeeRev_Avg copy.png

FP50 average

2017 average fee revenue: $784,258,000
% change year-over-year: 42.7%
Average commission revenue: $566,309,000
Average other revenue: $287,537,000
Average total revenue: $1,638,104,000
FP502018_FeeRev_No4 copy.png

4. Commonwealth Financial Network

Fee revenue: $798,295,000
% change year-over-year: 23.9%
Fee revenue rank: #4
Commission revenue: $245,870,000
Other revenue: $197,407,000
Total revenue: $1,241,572,000
FP50 rank: #4
2016 fee revenue: $644,518,000
2016 fee revenue rank: #4
FP502018_FeeRev_No3 copy.png

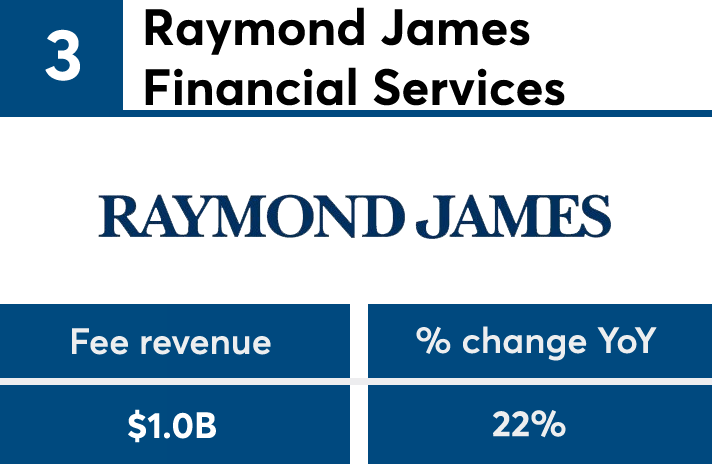
3. Raymond James Financial Services

Fee revenue: $1,041,912,000
% change year-over-year: 21.9%
Fee revenue rank: #3
Commission revenue: $671,486,000
Other revenue: $357,845,000
Total revenue: $2,071,244,000
FP50 rank: #3
2016 fee revenue: $854,728,000
2016 fee revenue rank: #3
FP502018_FeeRev_No2 copy.png

2. LPL Financial

Fee revenue: $1,409,248,000
% change year-over-year: 9.3%
Fee revenue rank: #2
Commission revenue: $1,670,824,000
Other revenue: $1,201,409,000
Total revenue: $4,281,481,000
FP50 rank: #1
2016 fee revenue: $1,285,309,000
2016 fee revenue rank: #2
FP502018_FeeRev_No1 copy.png

1. Ameriprise

Fee revenue: $2,332,589,000
% change year-over-year: 16.7%
Fee revenue rank: #1
Commission revenue: $1,199,834,000
Other revenue: $727,570,000
Total revenue: $4,259,992,000
FP50 rank: #2
2016 fee revenue: $1,998,023,000
2016 fee revenue rank: #1
MORE FROM FINANCIAL PLANNING