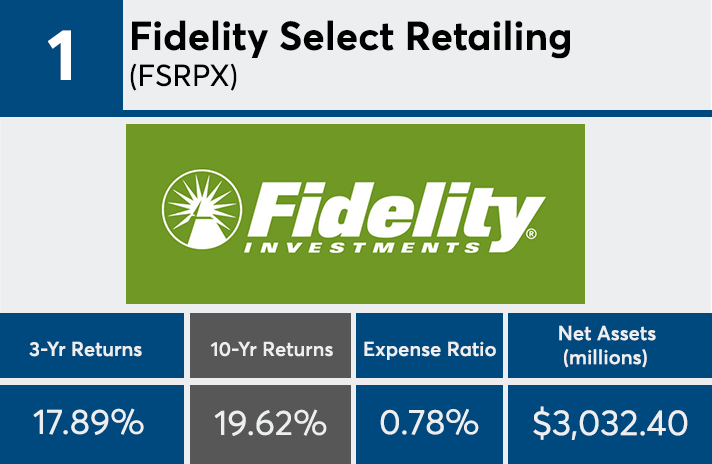
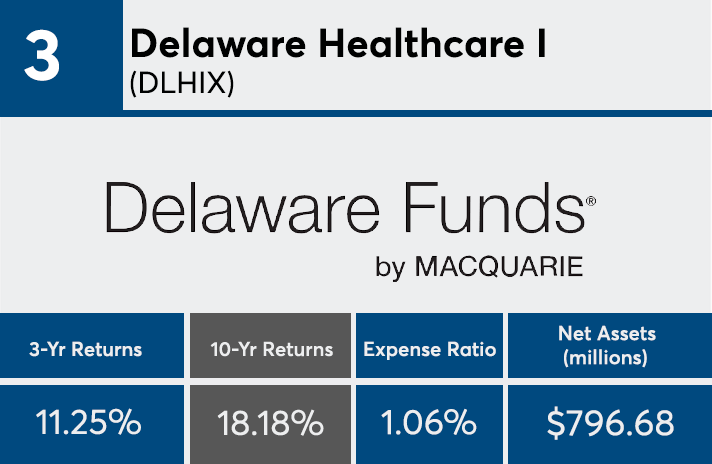
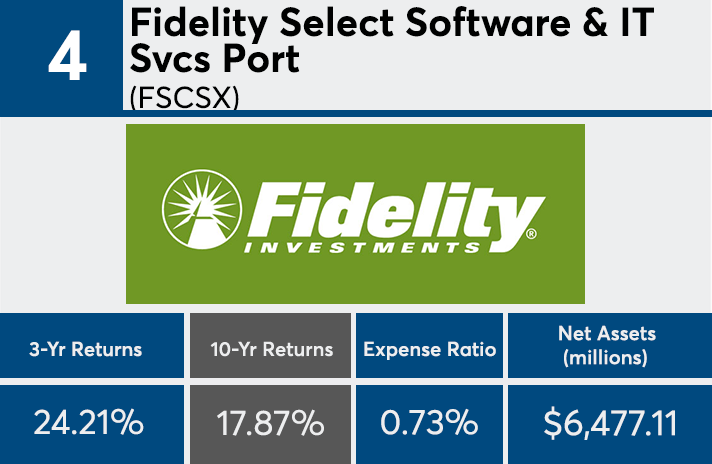
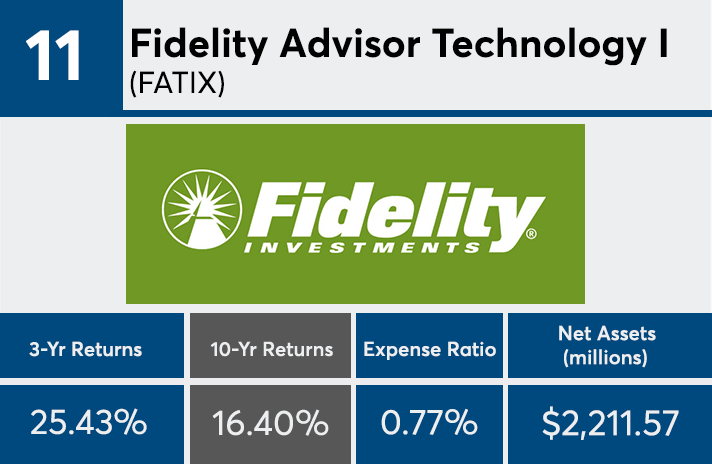
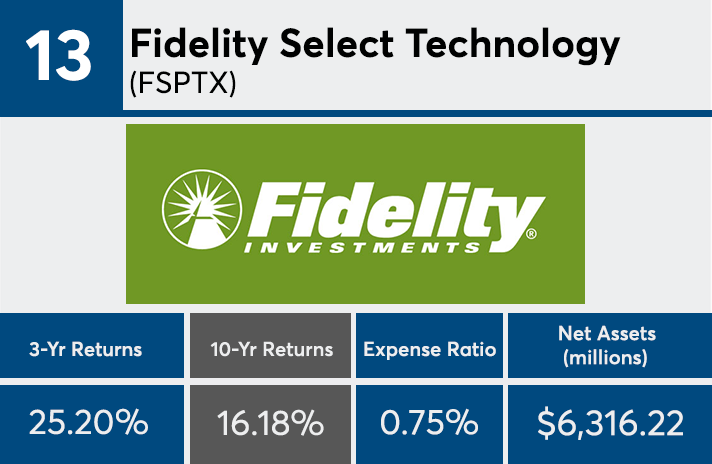
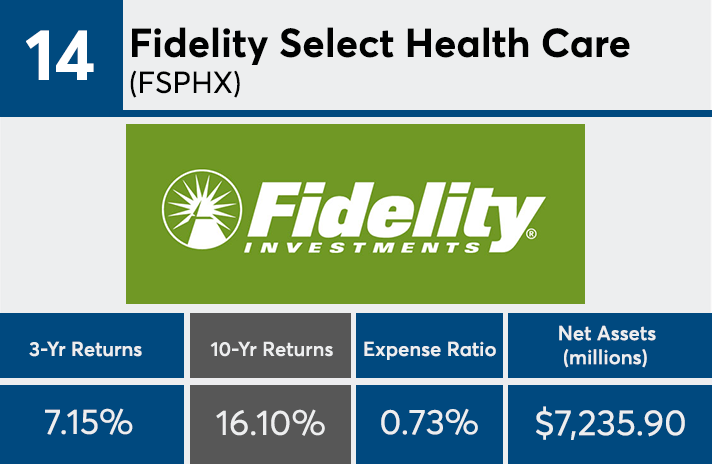
Although actively managed funds have lost considerable market share to passive competitors since the financial crisis, the top performers have posted an average 10-year return of 16.91%. Just over a third of all U.S. assets were in passive funds in 2017, up from about a fifth a decade prior, according to Bloomberg News.
Dominating the top 20 funds on this list are technology offerings, which account for $114 billion. The funds that topped the list posted nearly 20% annualized gains over 10 years, according to Morningstar Direct data.
“Many of the funds on this list have a sector bend, be it technology or health care,” notes Laura Lutton, a research executive at Morningstar. “We don’t see a lot of diversified, easy-to-use or -own funds on the list.”
The returns, however, came at a price. At around 0.87%, the average expense ratio is much higher compared with the universe of passively managed equity mutual funds. The average active fee fell to 0.78% in 2017 from 0.82% in 2016, according to Investment Company Institute data. The average expense ratio for actively managed bond funds dropped to 0.55% from 0.58% over the same periods.
“One reason advisors may stick with active is for tax purposes with a lot of these funds because they’ve done well over the last 10 years since the financial crisis,” Lutton suggests. “Passive could potentially create a taxable event for the client.”
Lutton says she was not surprised to see the Brown Capital Mgmt Small Co Inv (BCSIX) fund on the list. That fund’s team topped Morningstar’s fund management of the year domestic stock category in 2015. “What should be noted here are the themes of sector-specific funds and strong diversified funds with great teams behind them,” she says.
Scroll through to see the 20 actively managed funds with the biggest returns over the past decade. Funds with less than $250 million in client assets and investment minimums over $100,000 were excluded, as were leveraged and institutional funds. We also show three-year returns, assets and expense ratios for each fund. All data from Morningstar Direct.
