The 20 biggest mutual funds with the best 10-year returns

Size is always relative. For an industry steadily shifting towards low-cost investment products, the biggest mutual funds still managed to hang with the best over the past decade — but with some caveats.

For the 20 largest mutual funds, home to a combined $3 trillion in assets under management, their performance figures were largely better than their benchmarks, Morningstar Direct data show. With an overall gain of 10.56%, the lineup of stock and bond funds generally bested or matched the broader indexes. Over the past 12 months, many also outperformed.

For comparison, the SPDR S&P 500 ETF Trust (SPY) and the SPDR Dow Jones Industrial Average ETF (DIA) have had 10-year returns of 14.04% and 12.77%, respectively. In the past 12 months, SPY and DIA had gains of 44.34% and 40.09%. In bonds, the iShares Core U.S. Aggregate Bond ETF (AGG) recorded a 10-year gain of 3.32%, data show. Over the past year, the fund has had a loss of 0.30%.

Leigh Lowman, investment manager at Brinker Capital Investments, attributes much of the gains in stock funds with general exposure to U.S. large-cap growth.

“The outperformance of this asset class was largely attributed to a handful of technology stocks that are now some of the largest companies in the world,” Lowman says. “Facebook, Amazon, Apple, Netflix and Google, known as FAANG, experienced exponential growth during the past 10-years and the funds at the top of the list all held meaningful exposures to these companies.”

That said, nearly all of the industry’s biggest mutual funds have bled cash over the period, says Chris Shea, CFA and CIO of WealthSource.

“Most of the active funds are in outflows over the 10-year period and most of the passive funds are experiencing inflows,” Shea says, adding that the ranking here “shows in microcosm the larger trend playing out in the investment management industry which is the move to lower cost and more passive investment approaches.”

To be sure, many of the industry’s largest mutual funds — which have an overall 10-year outflow of more than $117 billion — are also home to high fees. With an average net expense ratio of roughly 55 basis points, the funds were pricier than the 0.45% investors paid, on average, for fund investing in 2019, according to Morningstar’s most recent annual fee survey.

Although the funds in this ranking benefited from their holdings in FAANG stocks, Benjamin Larsen, research analyst at Arnerich Massena, says they are also more limited in their investment opportunities because of liquidity.

“Advisors should be cognizant of investment strategies that focus on less liquid companies,” Larsen says, adding that they must “ensure that the mutual funds’ assets under management and liquidity needs align, because these funds often underperform their respective benchmark given their reduced investable universe.”

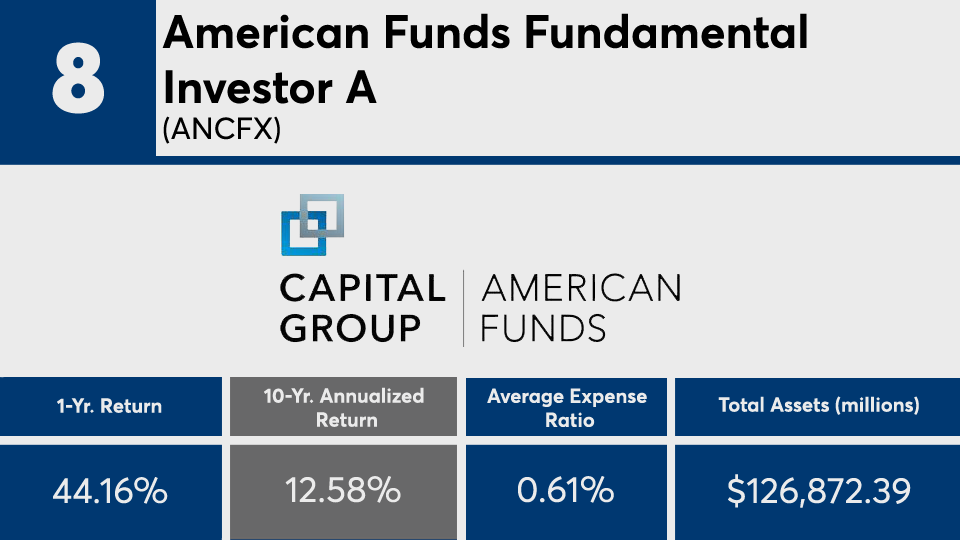
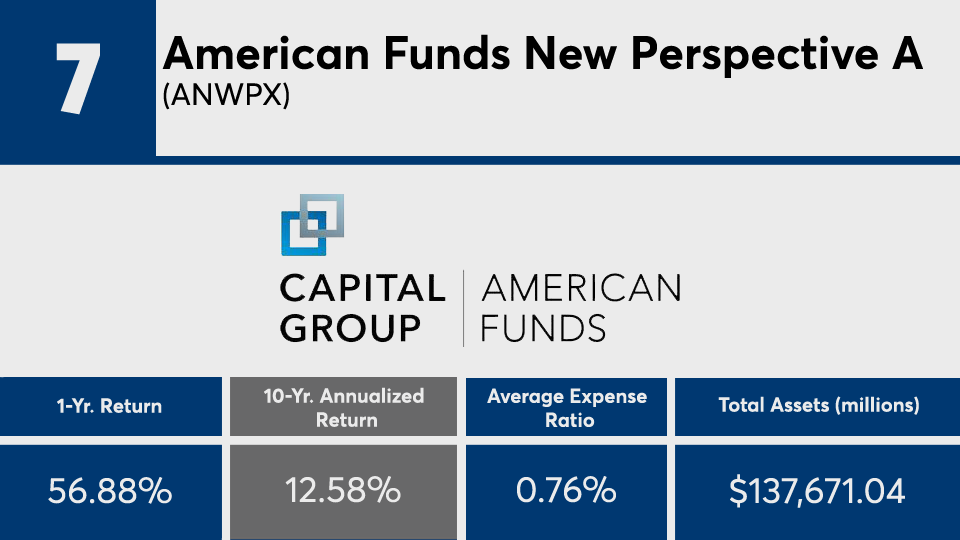
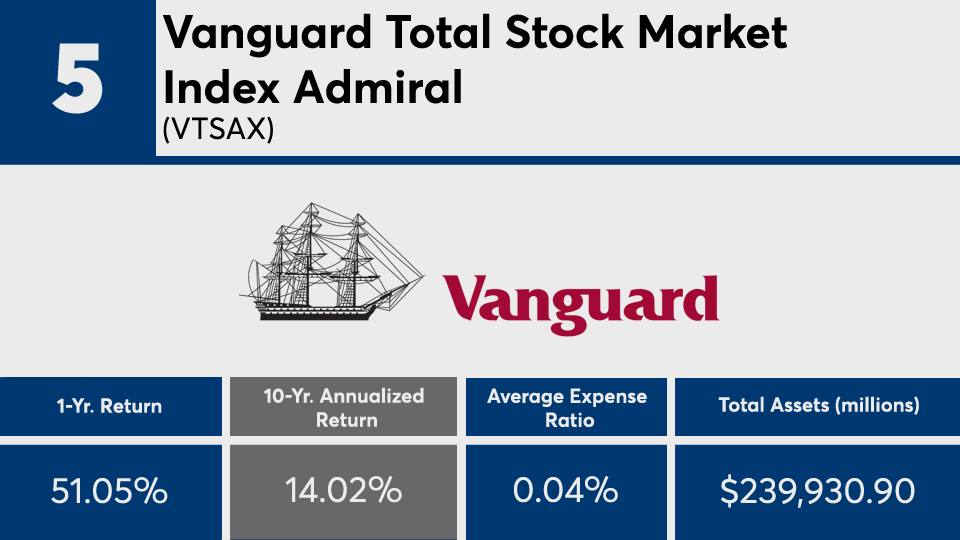
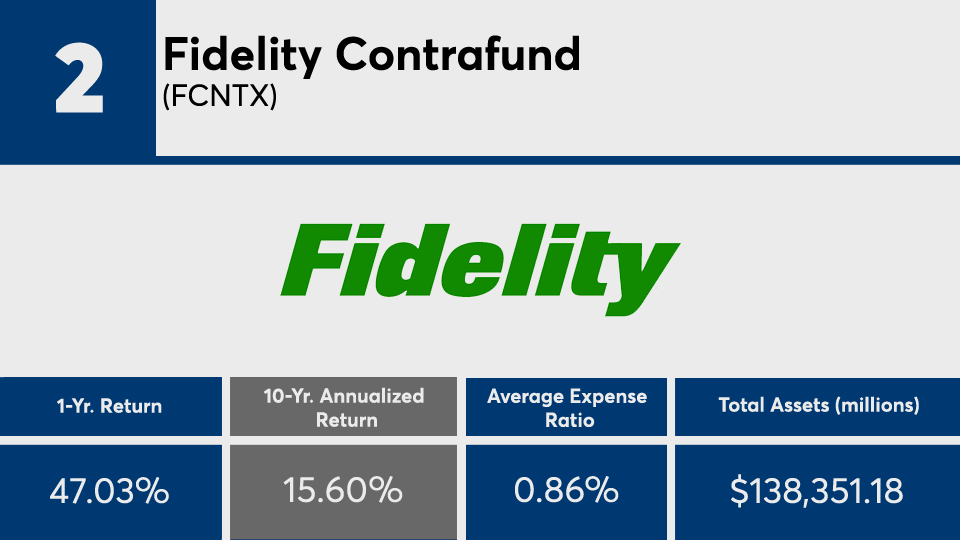
Scroll through to see the 20 largest mutual funds by net assets with the biggest 10-year annualized returns through April 30. Average expense ratios, loads, investment minimums, and manager names, as well as YTD, one-, three-, five- and 15-year returns and month-end share class flows through April 1 are also listed. The data show each fund's primary share class. All data is from Morningstar Direct.

FP050321_20 copy.png
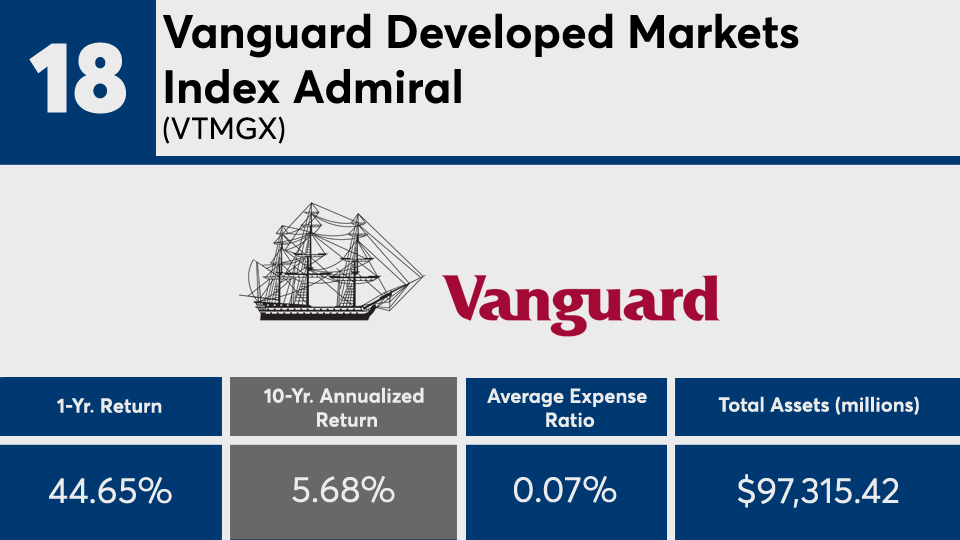
YTD Return: -2.8%; 3-Yr. Annualized Return: 5.04%; 5-Yr. Annualized Return: 3.02%; 15-Yr. Annualized Return: N/A; YTD Net Flow: (millions): $11,465.59; 1-Yr. Net Flow (millions): $34,068.75; 3-Yr. Net Flow (millions): $30,304.24; 5-Yr. Net Flow (millions): $63,622.05; 10-Yr. Net Flow (millions): $84,243.57; 15-Yr. Net Flow (millions): N/A; Inception Date: Jan. 26, 2009; Manager Name: Joshua C. Barrickman
FP050321_19 copy.png
YTD Return: -2.16%; 3-Yr. Annualized Return: 5.75%; 5-Yr. Annualized Return: 3.52%; 15-Yr. Annualized Return: 5.46%; YTD Net Flow: (millions): ($2,283.87); 1-Yr. Net Flow (millions): ($2,329.86); 3-Yr. Net Flow (millions): ($5,554.89); 5-Yr. Net Flow (millions): ($10,751.64); 10-Yr. Net Flow (millions): ($3,236.08); 15-Yr. Net Flow (millions): $2,266.50; Minimum Initial Investment: $5,000; Inception Date: March 31, 1997; Manager Names: Tad Rivelle, Laird R. Landmann, Stephen M. Kane and Bryan T. Whalen
FP050321_18 copy.png
YTD Return: 7.26%; 3-Yr. Annualized Return: 7.12%; 5-Yr. Annualized Return: 9.76%; 15-Yr. Annualized Return: 4.39%; YTD Net Flow: (millions): $224.53; 1-Yr. Net Flow (millions): ($590.32); 3-Yr. Net Flow (millions): $2,710.44; 5-Yr. Net Flow (millions): $7,339.46; 10-Yr. Net Flow (millions): $11,342.95; 15-Yr. Net Flow (millions): $11,563.94; Minimum Initial Investment: $3,000; Inception Date: Aug. 17, 1999; Manager Names: Michael Perre and Christine D. Franquin
FP050321_17 copy.png
YTD Return: 0.78%; 3-Yr. Annualized Return: 4.91%; 5-Yr. Annualized Return: 5.46%; 15-Yr. Annualized Return: N/A; YTD Net Flow: (millions): $242.05; 1-Yr. Net Flow (millions): ($763.25); 3-Yr. Net Flow (millions): ($9,910.06); 5-Yr. Net Flow (millions): ($6,762.39); 10-Yr. Net Flow (millions): ($916.12); 15-Yr. Net Flow (millions): N/A; Minimum Initial Investment: $1,000; Front Load: 3.75%; Inception Date: March 30, 2007; Manager Names: Daniel J. Ivascyn, Joshua Anderson and Alfred T. Murata
FP050321_16 copy.png
YTD Return: 7.71%; 3-Yr. Annualized Return: 7.58%; 5-Yr. Annualized Return: 7.18%; 15-Yr. Annualized Return: 5.81%; YTD Net Flow: (millions): ($893.85); 1-Yr. Net Flow (millions): ($3,991.71); 3-Yr. Net Flow (millions): ($14,917.29); 5-Yr. Net Flow (millions): ($25,537.70); 10-Yr. Net Flow (millions): ($32,817.10); 15-Yr. Net Flow (millions): ($28,394.24); Minimum Initial Investment: $250; Front Load: 5.75%; Inception Date: July 30, 1987; Manager Names: James B. Lovelace, David A. Hoag, Steven T. Watson, Joyce E. Gordon, Philip Winston, David M. Riley, Grant L. Cambridge, Fergus N. MacDonald, Bradley J. Vogt, L. Alfonso Barroso, Winnie Kwan, Caroline Randall and Aline Avzaradel
FP050321_15 copy.png
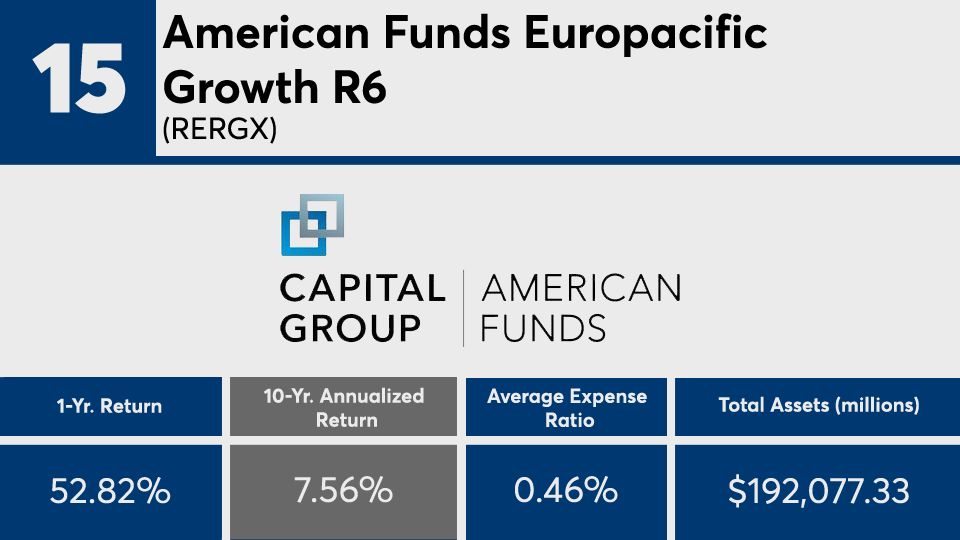
YTD Return: 3.17%; 3-Yr. Annualized Return: 11.42%; 5-Yr. Annualized Return: 13.4%; 15-Yr. Annualized Return: N/A; YTD Net Flow: (millions): ($4,552.71); 1-Yr. Net Flow (millions): ($8,927.85); 3-Yr. Net Flow (millions): ($5,395.39); 5-Yr. Net Flow (millions): $3,996.43; 10-Yr. Net Flow (millions): $29,176.58; 15-Yr. Net Flow (millions): N/A; Minimum Initial Investment: $250; Inception Date: May 1, 2009; Manager Names: Carl M. Kawaja, Jonathan Knowles, Andrew B. Suzman, Sung Lee, Nicholas J. Grace, Jesper Lyckeus, Noriko H. Chen, Christopher M. Thomsen, Lawrence Kymisis, Lara Pellini and Gerald Du Manoir
FP050321_14 copy.png
YTD Return: 8.83%; 3-Yr. Annualized Return: 9.52%; 5-Yr. Annualized Return: 9.25%; 15-Yr. Annualized Return: 7.07%; YTD Net Flow: (millions): ($735.33); 1-Yr. Net Flow (millions): ($3,158.03); 3-Yr. Net Flow (millions): ($12,198.40); 5-Yr. Net Flow (millions): ($22,516.64); 10-Yr. Net Flow (millions): ($27,278.61); 15-Yr. Net Flow (millions): ($31,770.60); Minimum Initial Investment: $250; Front Load: 5.75%; Inception Date: Nov. 30, 1973; Manager Names: Dina N. Perry, John R. Queen, Hilda L. Applbaum, Joyce E. Gordon, Andrew B. Suzman, Anirudh A. Samsi, David A. Daigle, Bradley J. Vogt, Paul Flynn, Pramod Atluri, Shannon Ward and Caroline Randall
FP050321_13 copy.png
YTD Return: 8.04%; 3-Yr. Annualized Return: 11.3%; 5-Yr. Annualized Return: 12.84%; 15-Yr. Annualized Return: 7.52%; YTD Net Flow: (millions): ($650.66); 1-Yr. Net Flow (millions): ($2,984.55); 3-Yr. Net Flow (millions): ($12,262.99); 5-Yr. Net Flow (millions): ($22,947.22); 10-Yr. Net Flow (millions): ($41,151.35); 15-Yr. Net Flow (millions): ($41,300.01); Minimum Initial Investment: $250; Front Load: 5.75%; Inception Date: March 26, 1993; Manager Names: Sung Lee, Michael Cohen, David M. Riley, L. Alfonso Barroso, Jeremy Burge, Leo Hee;Jin Lee, Alex Sheynkman and Lara Pellini
FP050321_12 copy.png
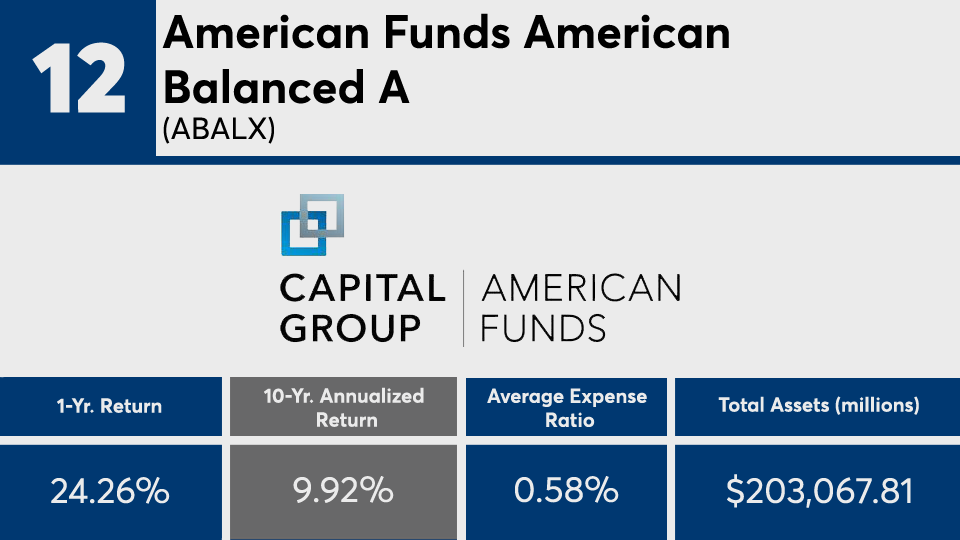
YTD Return: 6.8%; 3-Yr. Annualized Return: 11.48%; 5-Yr. Annualized Return: 10.82%; 15-Yr. Annualized Return: 8.09%; YTD Net Flow: (millions): $1,654.94; 1-Yr. Net Flow (millions): $3,768.08; 3-Yr. Net Flow (millions): $7,264.28; 5-Yr. Net Flow (millions): $7,906.20; 10-Yr. Net Flow (millions): $9,732.85; 15-Yr. Net Flow (millions): $2,916.19; Minimum Initial Investment: $250; Front Load: 5.75%; Inception Date: July 25, 1975; Manager Names: Alan N. Berro, John R. Queen, Alan J. Wilson, Hilda L. Applbaum, Jeffrey T. Lager, Pramod Atluri, Mark L. Casey, Ritchie Tuazon, Paul R. Benjamin and Anne-Marie Peterson
FP050321_11 copy.png
YTD Return: 7.88%; 3-Yr. Annualized Return: 12.87%; 5-Yr. Annualized Return: 11.79%; 15-Yr. Annualized Return: 8.71%; YTD Net Flow: (millions): ($1,309.75); 1-Yr. Net Flow (millions): ($6,211.79); 3-Yr. Net Flow (millions): ($15,336.62); 5-Yr. Net Flow (millions): ($13,879.04); 10-Yr. Net Flow (millions): $7,642.08; 15-Yr. Net Flow (millions): $17,824.64; Minimum Initial Investment: $50,000; Inception Date: May 14, 2001; Manager Names: Michael E. Stack, Daniel J. Pozen and Loren L. Moran;
FP050321_10 copy.png
YTD Return: 11.3%; 3-Yr. Annualized Return: 14.2%; 5-Yr. Annualized Return: 14.07%; 15-Yr. Annualized Return: 8.89%; YTD Net Flow: (millions): ($958.05); 1-Yr. Net Flow (millions): ($3,351.18); 3-Yr. Net Flow (millions): ($12,079.59); 5-Yr. Net Flow (millions): ($22,445.94); 10-Yr. Net Flow (millions): ($40,352.96); 15-Yr. Net Flow (millions): ($64,409.03); Minimum Initial Investment: $250; Front Load: 5.75%; Inception Date: Jan. 2, 1934; Manager Names: James B. Lovelace, Donald D. O'Neal, Joyce E. Gordon, Grant L. Cambridge, Christopher D. Buchbinder, Barry S. Crosthwaite, James Terrile, Martin Romo and Martin Jacobs
FP050321_9 copy.png
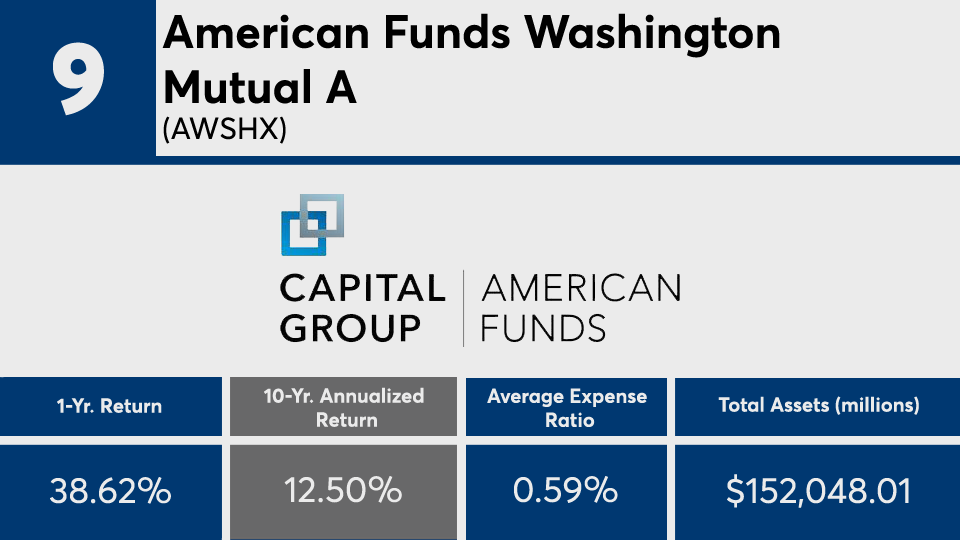
YTD Return: 12.74%; 3-Yr. Annualized Return: 14.12%; 5-Yr. Annualized Return: 14.41%; 15-Yr. Annualized Return: 9.12%; YTD Net Flow: (millions): ($613.08); 1-Yr. Net Flow (millions): ($2,929.87); 3-Yr. Net Flow (millions): ($8,255.42); 5-Yr. Net Flow (millions): ($17,398.36); 10-Yr. Net Flow (millions): ($30,250.04); 15-Yr. Net Flow (millions): ($55,883.22); Minimum Initial Investment: $250; Front Load: 5.75%; Inception Date: July 31, 1952; Manager Name: Alan N. Berro, Alan J. Wilson, Brady L. Enright, Eric H. Stern, Irfan M. Furniturewala, Jeffrey T. Lager, Mark L. Casey, Jin Lee and Diana Wagner
FP050321_8 copy.png
YTD Return: 10.85%; 3-Yr. Annualized Return: 15.07%; 5-Yr. Annualized Return: 15.6%; 15-Yr. Annualized Return: 9.69%; YTD Net Flow: (millions): ($778.51); 1-Yr. Net Flow (millions): ($2,950.96); 3-Yr. Net Flow (millions): ($9,655.46); 5-Yr. Net Flow (millions): ($17,312.08); 10-Yr. Net Flow (millions): ($25,332.04); 15-Yr. Net Flow (millions): ($22,830.14); Minimum Initial Investment: $250; Front Load: 5.75%; Inception Date: Aug. 1, 1978; Manager Names: Dina N. Perry, Brady L. Enright, Irfan M. Furniturewala, Julian N. Abdey, Mark L. Casey, Paul R. Benjamin and Mathews Cherian
FP050321_7 copy.png
YTD Return: 7.41%; 3-Yr. Annualized Return: 19.51%; 5-Yr. Annualized Return: 18.52%; 15-Yr. Annualized Return: 10.21%; YTD Net Flow: (millions): ($79.92); 1-Yr. Net Flow (millions): ($1,058.17); 3-Yr. Net Flow (millions): ($5,128.81); 5-Yr. Net Flow (millions): ($11,303.78); 10-Yr. Net Flow (millions): ($20,840.51); 15-Yr. Net Flow (millions): ($33,847.88); Minimum Initial Investment: $250; Front Load: 5.75%; Inception Date: March 13, 1973; Manager Names: Robert W. Lovelace, Steven T. Watson, Jonathan Knowles, Andraz Razen, Jody F. Jonsson, Brady L. Enright and Noriko H. Chen
FP050321_6 copy.png
YTD Return: 10%; 3-Yr. Annualized Return: 16.62%; 5-Yr. Annualized Return: 16.71%; 15-Yr. Annualized Return: 10.4%; YTD Net Flow: (millions): ($535.51); 1-Yr. Net Flow (millions): ($1,613.25); 3-Yr. Net Flow (millions): ($4,077.08); 5-Yr. Net Flow (millions): ($8,423.89); 10-Yr. Net Flow (millions): ($7,788.79); 15-Yr. Net Flow (millions): ($10,964.37); Minimum Initial Investment: $250; Front Load: 5.75%; Inception Date: May 1, 1967; Manager Name: Gregory Wendt, Aidan O'Connell, Lawrence R. Solomon, Eric H. Stern, Cheryl E. Frank, Barry S. Crosthwaite, James Terrile and Jessica Spaly
FP050321_5 copy.png
YTD Return: 11.89%; 3-Yr. Annualized Return: 18.95%; 5-Yr. Annualized Return: 17.67%; 15-Yr. Annualized Return: 10.44%; YTD Net Flow: (millions): ($47.24); 1-Yr. Net Flow (millions): ($23,983.04); 3-Yr. Net Flow (millions): ($13,071.30); 5-Yr. Net Flow (millions): ($484.1); 10-Yr. Net Flow (millions): $31,521.39; 15-Yr. Net Flow (millions): $52,989.04; Minimum Initial Investment: $3,000; Inception Date: Nov. 13, 2000; Manager Name: Gerard C. O’Reilly and Walter Nejman
FP050321_4 copy.png
YTD Return: 11.84%; 3-Yr. Annualized Return: 18.63%; 5-Yr. Annualized Return: 17.38%; 15-Yr. Annualized Return: 10.28%; YTD Net Flow: (millions): ($2,572.10); 1-Yr. Net Flow (millions): ($16,080.83); 3-Yr. Net Flow (millions): $567.59; 5-Yr. Net Flow (millions): $24,085.11; 10-Yr. Net Flow (millions): $60,405.37; 15-Yr. Net Flow (millions): $66,571.67; Minimum Initial Investment: $3,000; Inception Date: Nov. 13, 2000; Manager Names: Donald M. Butler and Michelle Louie
FP050321_3 copy.png
YTD Return: 8.07%; 3-Yr. Annualized Return: 21.06%; 5-Yr. Annualized Return: 20.67%; 15-Yr. Annualized Return: 10.98%; YTD Net Flow: (millions): ($619.61); 1-Yr. Net Flow (millions): ($1,860.97); 3-Yr. Net Flow (millions): ($11,488.15); 5-Yr. Net Flow (millions): ($25,606.13); 10-Yr. Net Flow (millions): ($51,622.29); 15-Yr. Net Flow (millions): ($70,744.22); Minimum Initial Investment: $250; Front Load: 5.75%; Inception Date: Nov. 30, 1973; Manager Names: Donald D. O'Neal, Carl M. Kawaja, J. Blair Frank, Alan J. Wilson, Lawrence R. Solomon, Andraz Razen, Jody F. Jonsson, Christopher D. Buchbinder, Barry S. Crosthwaite, Martin Romo, Mark L. Casey, Anne-Marie Peterson and Alex Popa
FP050321_2 copy.png
YTD Return: 9.69%; 3-Yr. Annualized Return: 21.05%; 5-Yr. Annualized Return: 20.71%; 15-Yr. Annualized Return: 11.94%; YTD Net Flow: (millions): ($4,770.91); 1-Yr. Net Flow (millions): ($12,719.64); 3-Yr. Net Flow (millions): ($31,435.35); 5-Yr. Net Flow (millions): ($44,563.61); 10-Yr. Net Flow (millions): ($67,220.09); 15-Yr. Net Flow (millions): ($82,459.87); Inception Date: May 17, 1967; Manager Name: William Danoff
FP050321_1 copy.png
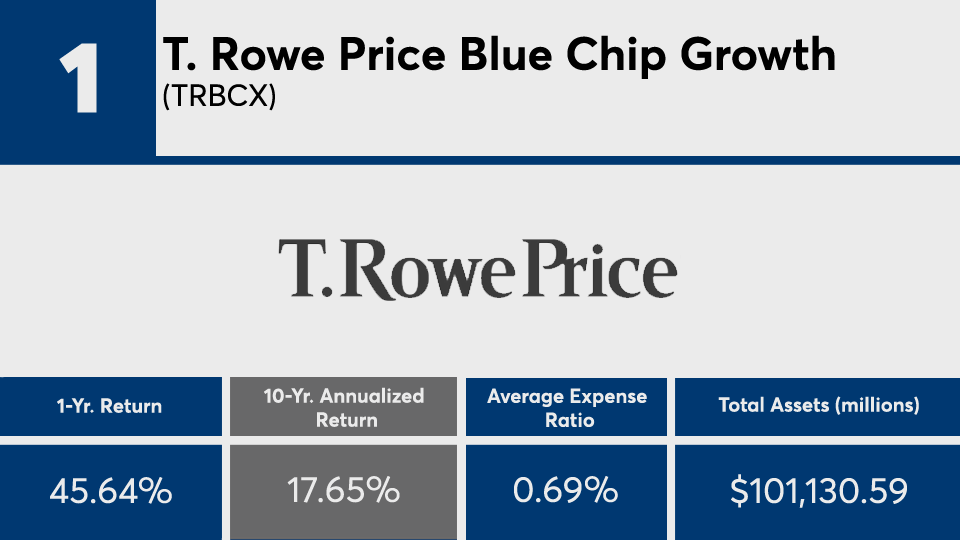
YTD Return: 7.96%; 3-Yr. Annualized Return: 21.48%; 5-Yr. Annualized Return: 23.02%; 15-Yr. Annualized Return: 13.04%; YTD Net Flow: (millions): ($1,944.41); 1-Yr. Net Flow (millions): ($3,390.05); 3-Yr. Net Flow (millions): ($4,686.47); 5-Yr. Net Flow (millions): ($6,768.65); 10-Yr. Net Flow (millions): ($2,543.45); 15-Yr. Net Flow (millions): ($1,811.48); Minimum Initial Investment: $2,500 Inception Date: June 30, 1993; Manager Name: Larry J. Puglia
MORE FROM FINANCIAL PLANNING