With corporates leading the industry’s top-performing fixed income funds of 2019, it’s no surprise government bonds were among the worst.
Unlike
“In a year when interest rates decline, like 2019, the bond funds with the lowest returns are going to be shorter-term bond funds because they don’t see the price appreciation of longer-maturity bonds,” McBride says.
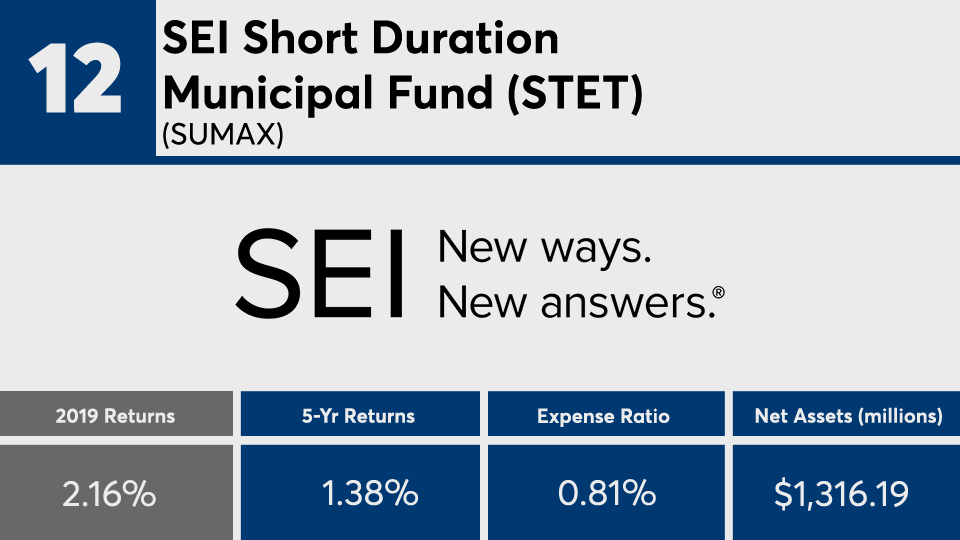
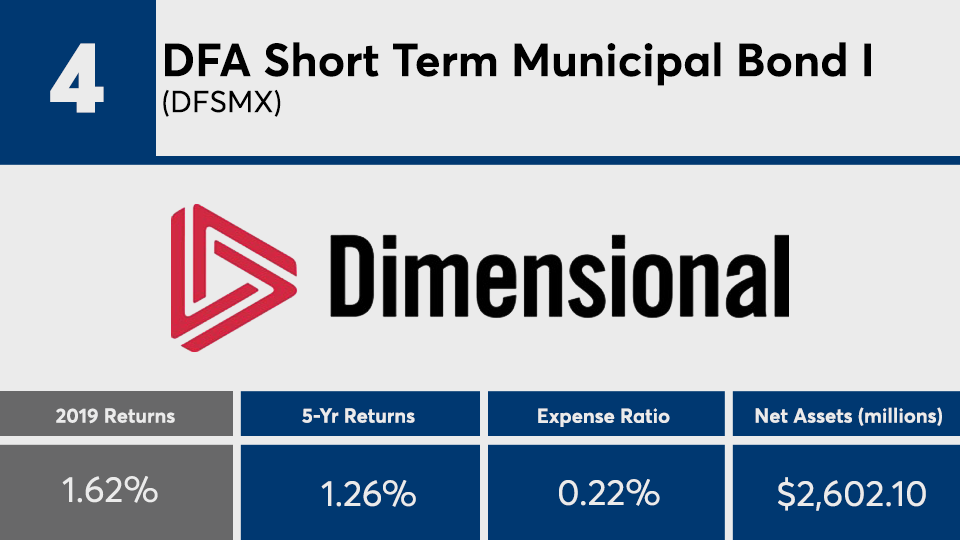
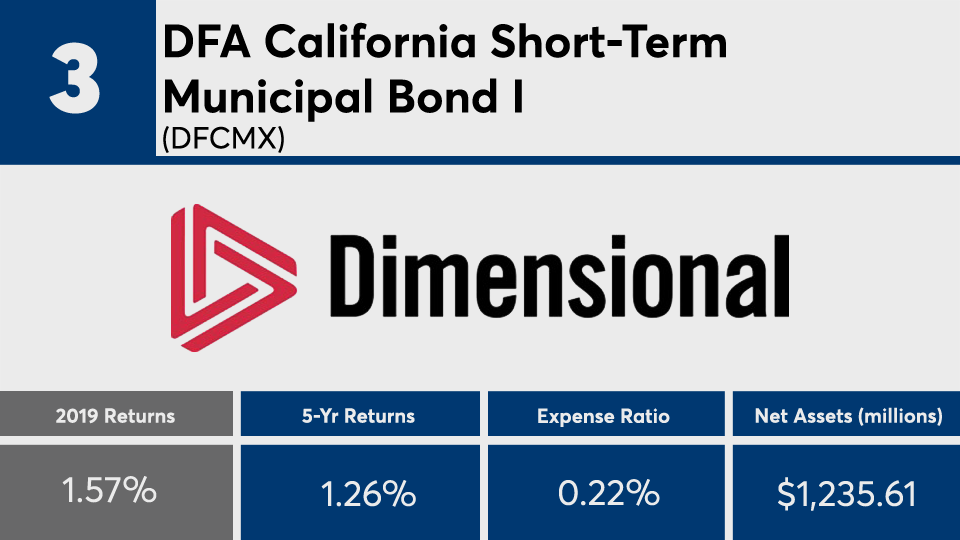
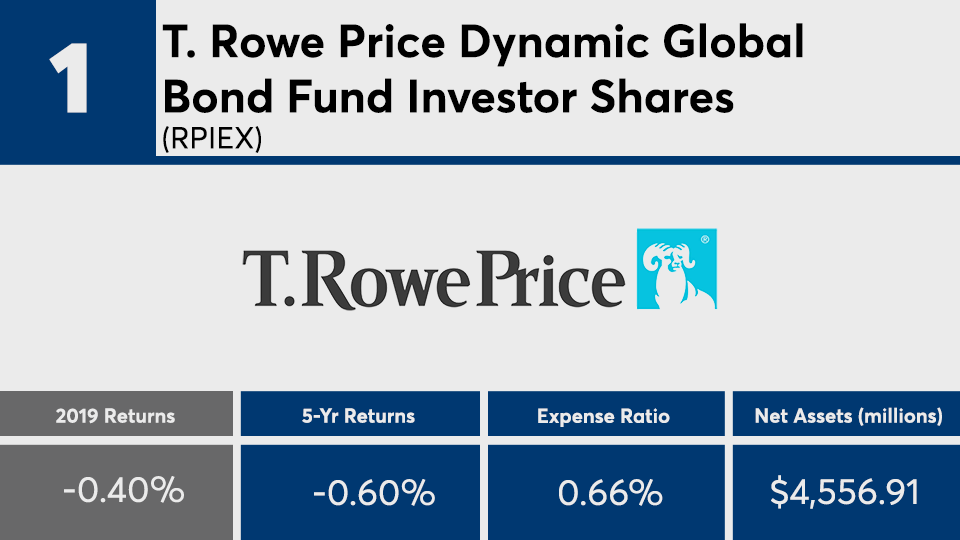
Nearly all of last year's worst-performing fixed income funds shorted municipal bonds and Treasurys, data show. With an average gain of less than 2%, these funds were significantly outpaced by the broader Bloomberg Barclays Aggregate Bond Index’s 8.46% gain, as measured by the iShares Core US Aggregate Bond ETF (AGG).
Fees, however, were lower than the broader fund industry. With an average net expense ratio of 0.33%, these bond funds were right on target with the top-performers’ average fee of 33 basis points, but 0.15% cheaper than the 0.48% investors were charged, on average, for fund investing last year, according to Morningstar’s most recent annual fee survey, which reviewed the asset-weighted average expense ratios of all U.S. open-end mutual funds and ETFs.
The largest bond fund, the $248.6 billion Vanguard Total Bond Market Index Admiral Shares (VBTLX), had a 0.05% expense ratio and 8.71% return in 2019, data show. (On the equity side, the biggest overall fund, the $897.7 billion Vanguard Total Stock Market Index Fund Admiral Shares (VTSAX), had a 0.04% expense ratio and a 30.8% return over the same period.)
“All else being equal, short-term bond funds tend to have lower returns than longer-term bond funds because of lower coupon rates,” McBride explains. “But the lower returns are particularly pronounced in a year where interest rates decline as higher duration bonds get a bigger boost in value, relatively speaking.”
Scroll through to see the 20 fixed-income category mutual funds and ETFs with the worst returns as of 2019. Funds with less than $500 million in AUM and investment minimums over $100,000 were excluded, as were leveraged and institutional funds. Assets and expense ratios for each, as well as three-year net flows and year-to-date returns, are also listed. The data shows each fund's primary share class. All data from Morningstar Direct.


