Client preference for low-cost sometimes outweighs performance. That’s the case for the 20 bond funds with the largest outflows.
The 20 fixed-income mutual funds and ETFs on this list hold more than a quarter-trillion dollars in combined assets under management, Morningstar Direct data show. Although a smaller slice of the bond fund industry than
“The bond funds with the biggest outflows underscore the move investors have made out of higher-cost, sometimes niche, actively managed funds into lower cost, broader index funds,” McBride says.
Fees among the bond sector’s least popular products are high, as expected. At nearly 0.52%, the average expense ratio is more than twice as much as the 0.24% average among funds with the largest inflows, and 4 basis points higher than the 0.48% investors paid on average for fund investing last year, according to Morningstar’s most recent annual fee survey, which reviewed the asset-weighted average expense ratios of all U.S. open-end mutual funds and ETFs. With $229 billion in AUM, the industry’s largest bond fund, the Vanguard Total Bond Market Index Fund Admiral Shares (VBTLX), has an expense ratio of 0.05% and three-year net inflows of $24 billion, data show.
Analysis of the funds’ performance shows a seemingly different story. With an average three-year gain of 3.75%, these funds outpaced the 2.50% return of the 20 bond funds with the largest inflows, data show. They even bested the Bloomberg Barclays U.S. Aggregate Bond Index’s 2.05%, as measured by the iShares Core US Aggregate Bond ETF (AGG), over the same period, according to data.
Why the outperformance? Some of the same features that made the funds unpopular may also be what uncorrelated them from their peers, McBride says.
“The funds that performed the best were more narrowly invested — mostly high-yield, aka, junk bond funds,” McBride said. “By nature, these are feast or famine. They can outperform broad bond indexes for a period, but when they fall, they fall hard.”
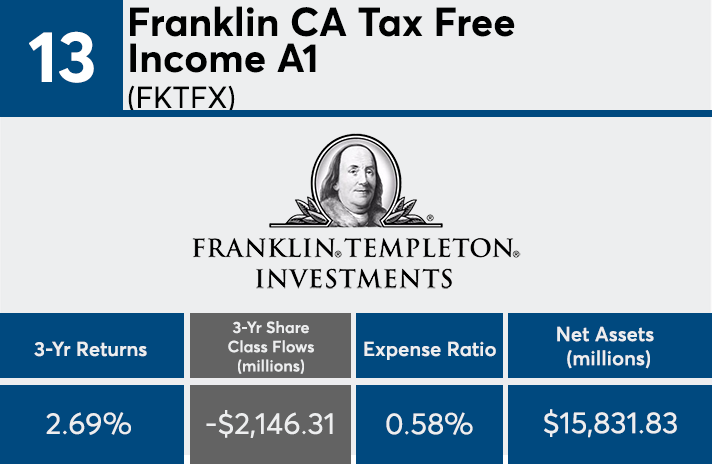
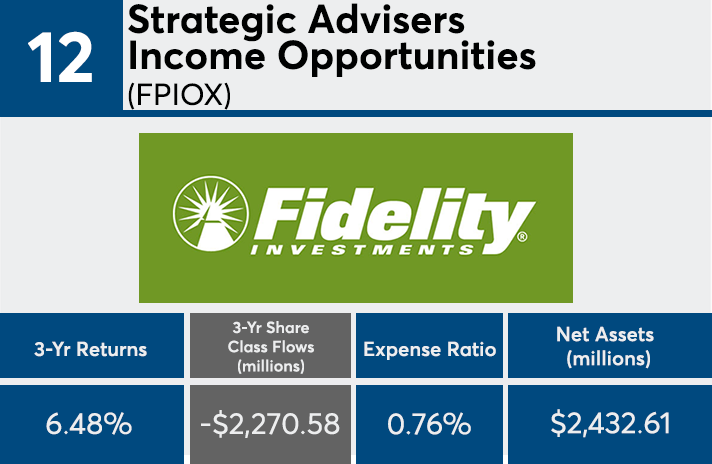
Scroll through to see the 20 fixed-income funds ranked by their estimated share class net outflows through June. Funds with less than $500 million in AUM and investment minimums over $100,000 were excluded, as were ETNs, leveraged and institutional funds. Assets and expense ratios for each fund, as well as three-year daily returns through July 25, are also listed. The data is based on each fund's primary share class.


