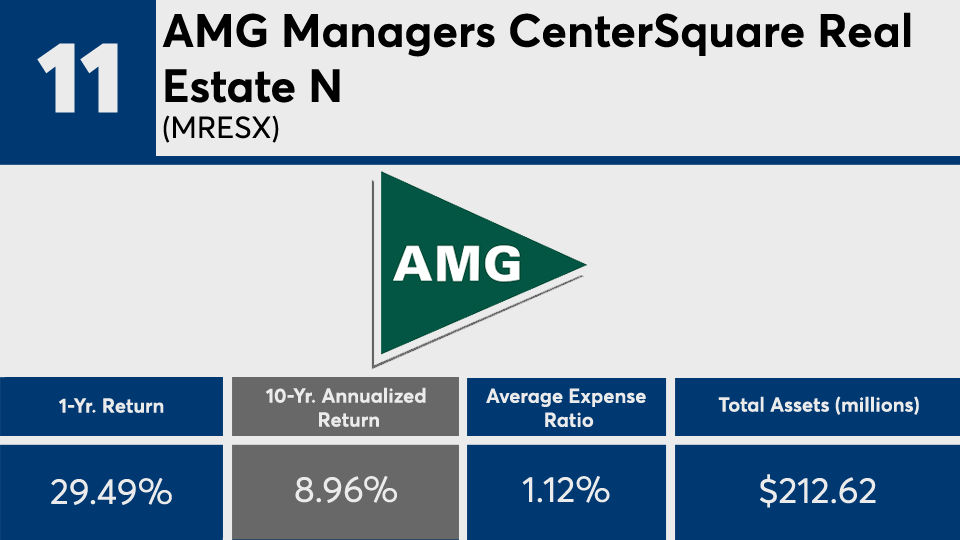
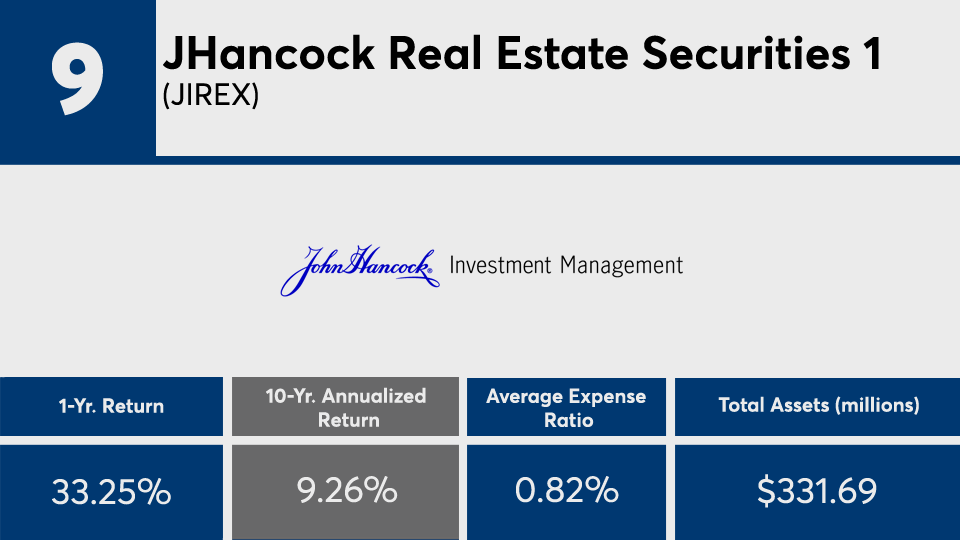
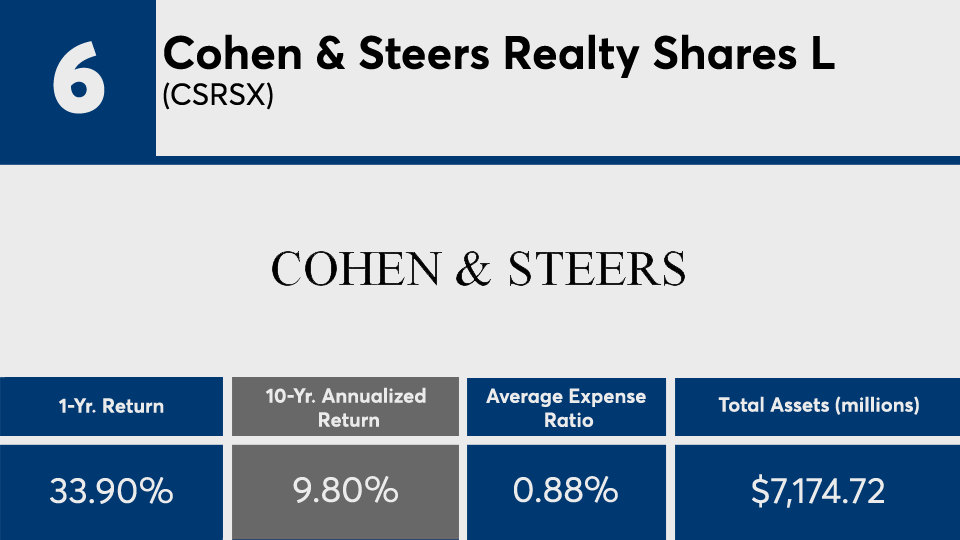
Even the best-performing real estate funds have struggled in the years following the financial crisis.
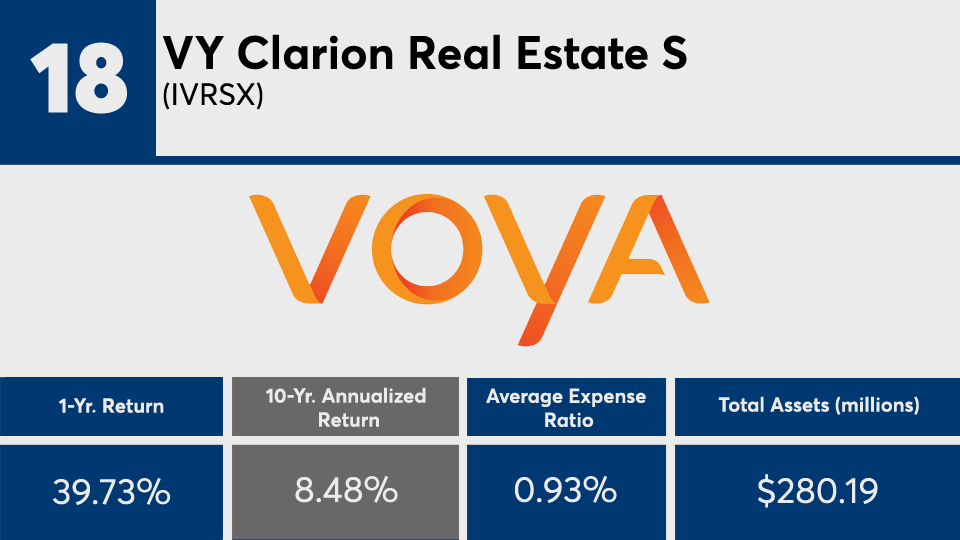
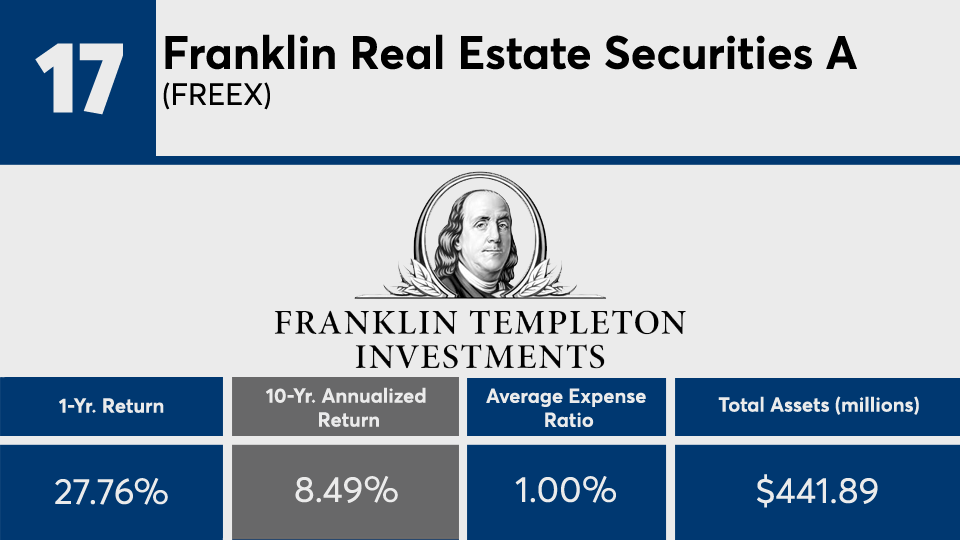
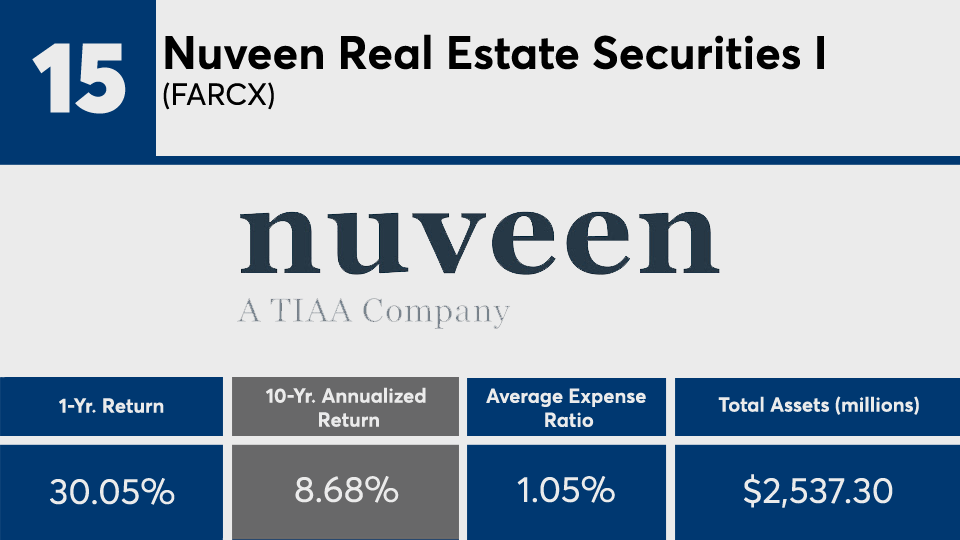
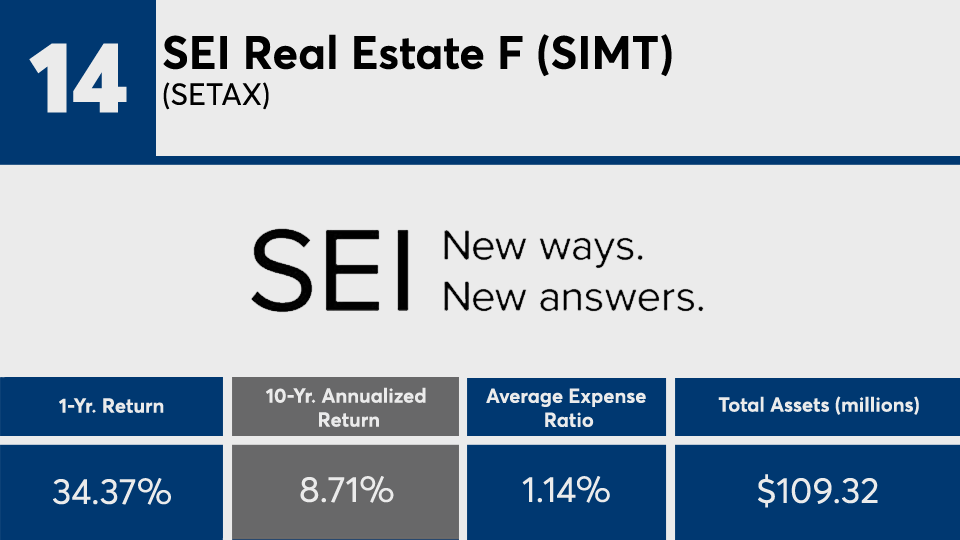
The 20 top-performers tracking the sector, with at least $100 million in assets under management, underperformed broader indexes with an average 10-year gain of roughly 9.5%, Morningstar Direct data show. Over the past year, the same funds notched an overall return of 35%, largely overshadowed by a 12-month surge in U.S. equities.
When considering returns on a rolling basis from the funds in this ranking, most have done better year-over-year. That said, if you look at performance long before the start of the COVID-19 pandemic, Wealthcare Chief Investment Officer Ron Madey, says the results are much more of a mixed bag.
“The successful long-term players have the long-term tech driven trends right, and COVID just accelerated and magnified the trends,” Madey says. “For example, brick and mortar retail, especially regional malls, are in decline with the rise in online shopping and data centers on the rise and outperforming.”

Pitted against broader markets, the funds here have largely underperformed. Index trackers such as the SPDR S&P 500 ETF Trust (
In bonds, the iShares Core U.S. Aggregate Bond ETF (
Underperformance among the top funds in the sector have also come with a high price tag. With an average net expense ratio of 102 basis points, the funds here were more than twice the 0.45% investors paid on average for fund investing in 2019, according to
For advisors with clients seeking overall outperformance from any specific sector, industry consultant Marc Pfeffer says it is critical to explain asset allocation.
“Manager performance is going to be the difference with funds here, and you want to make sure what they have under the hood aligns with what you want to own or what you believe in,” Pfeffer says. “You're going to see a lot of the holdings in top-performers from things like gaming stocks.”
Scroll through to see the 20 real estate sector funds with the best 10-year returns, and at least $100 million in AUM, through May 31. Net expense ratios, loads, investment minimums, and manager names, as well as YTD, one-, three-, five- and 15-year returns and month-end share class flows through May 1 are also listed. The data show each fund's primary share class. Leveraged, institutional and funds with investment minimums over $100,000 have been excluded. All data is from Morningstar Direct.


