As in many industries, value doesn’t necessarily correlate with performance in the world of fund investing.
The 20 funds with the lowest trailing 12-month price-to-earnings ratios, and at least $500 million in assets under management, underperformed the broader indexes over both the short- and longer-term horizons, Morningstar Direct data show. With an average P/E ratio of just over 9.5, they generated an overall 12-month gain of roughly 43.3%. Over the past three years, the same funds had a return of just under 9%.

For comparison, index trackers such as the SPDR S&P 500 ETF Trust (
In bonds, the iShares Core U.S. Aggregate Bond ETF (
For clients solely looking to the metric for an indicator of performance, Steve Skancke, chief economic advisor at Keel Point, says low P/E ratios as a principal selection criteria resulted in disappointing results.
“There is no positive correlation between P/E and performance, only an incidental one in the last 12 months and year-to-date time periods,” Skancke says. “Half of the funds are investing in bonds — and equivalents — and one-quarter are investing in a value equity strategy, which has been favored over the past six months.”
Value aside, the 20 funds in this ranking carried fees that were nearly twice the industry average. With an average net expense ratio of 87 basis points, they are well above the 0.45% investors paid on average for fund investing in 2019, according to
For advisors and clients looking for the best value for their long-term investments, Skancke says they must keep in mind that P/E ratios are largely an indicator of strategy.
“Some assets are cheap for a reason, and without a strategy story around why they are attractive, they may stay cheaply priced and underperform their peer group,” he says. “For example, value stocks tend to have lower P/E ratios and growth stocks tend to have higher P/E ratios. Their out-performance or underperformance over time tends to be driven by other macroeconomic and industry factors not correlated with P/E ratios.”
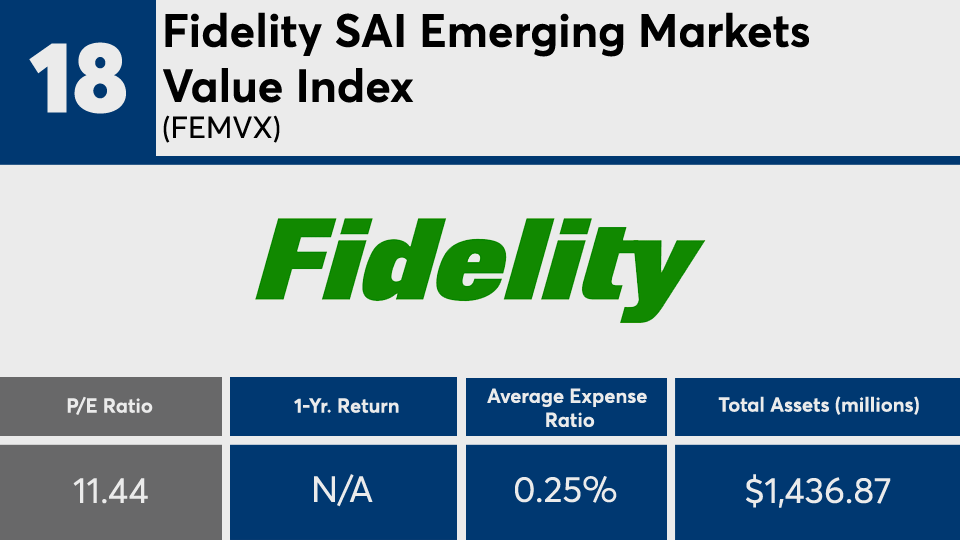
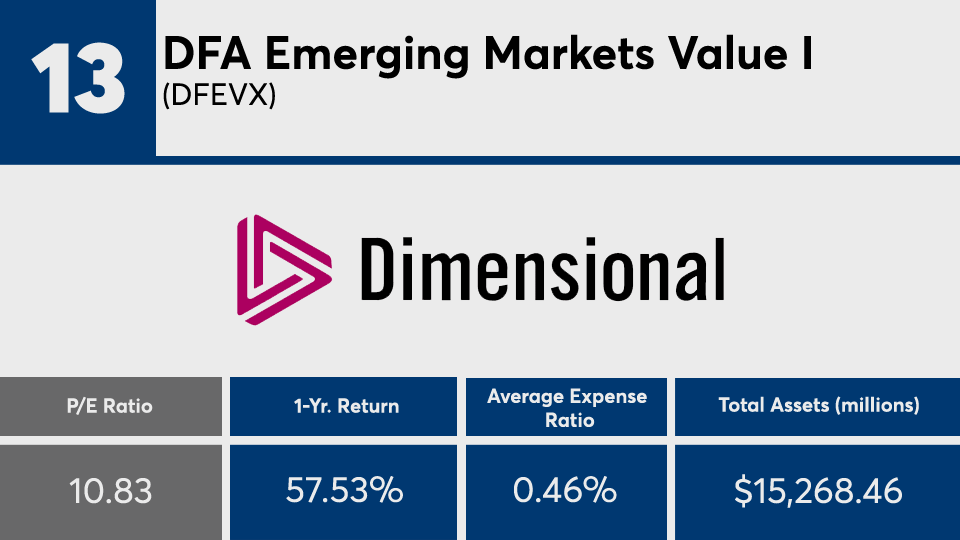
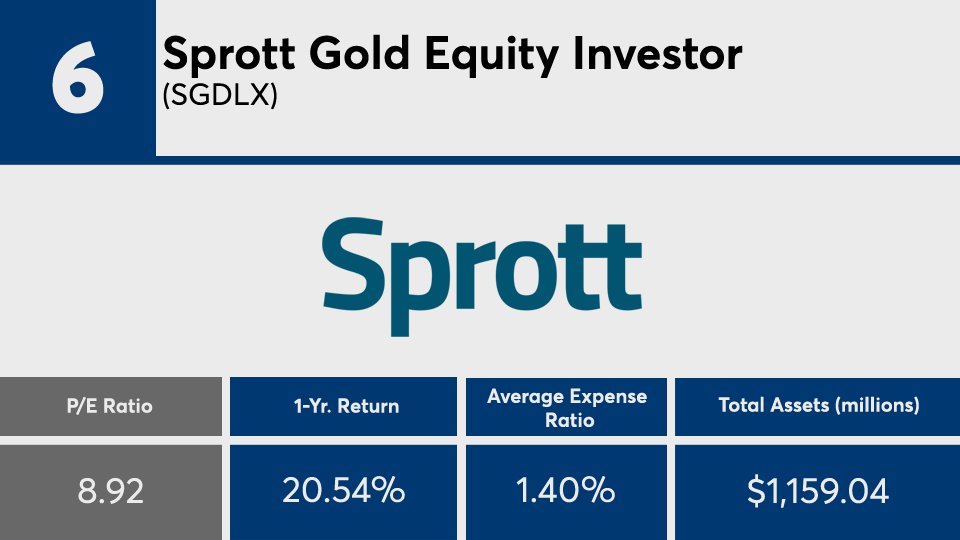
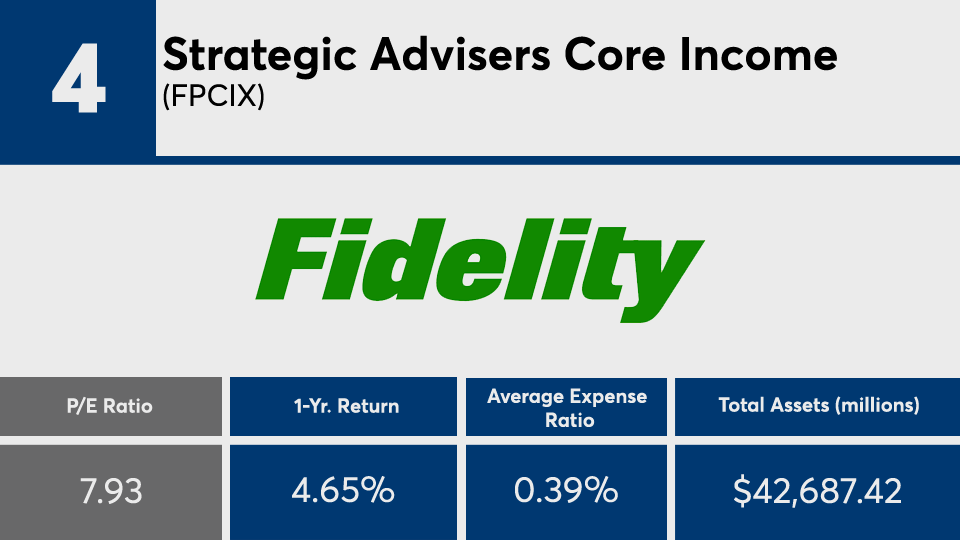
Scroll through to see the 20 funds with the lowest trailing 12-month P/E ratios and with at least $500 million in AUM through May 6. Average expense ratios, loads, investment minimums, and manager names, as well as YTD, one-, three-, five- and 15-year returns and month-end share class flows through May 1 are also listed. The data show each fund's primary share class. All data is from Morningstar Direct.


