Tax

How many millionaires? Tax returns by income group for 2024

Complimentary Access Pill
Enjoy complimentary access to top ideas and insights — selected by our editors.

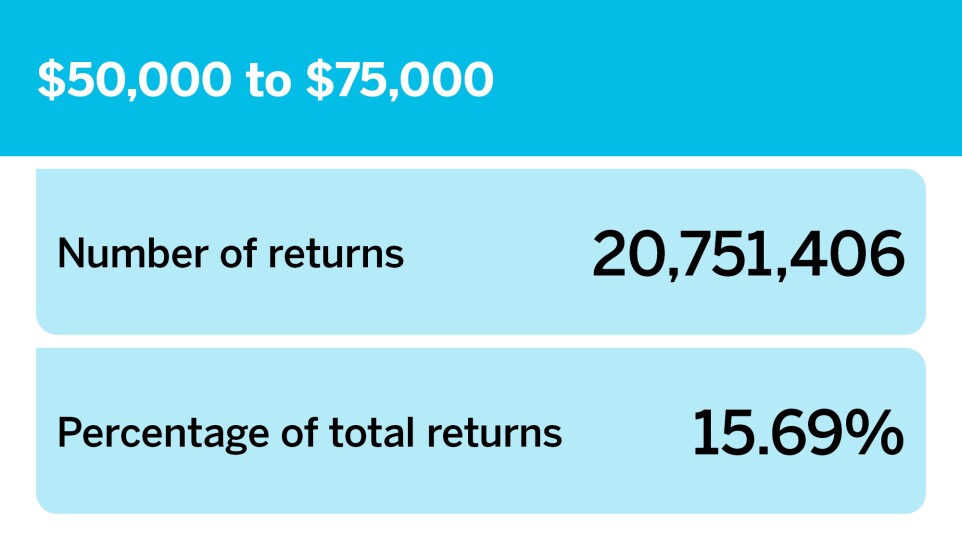
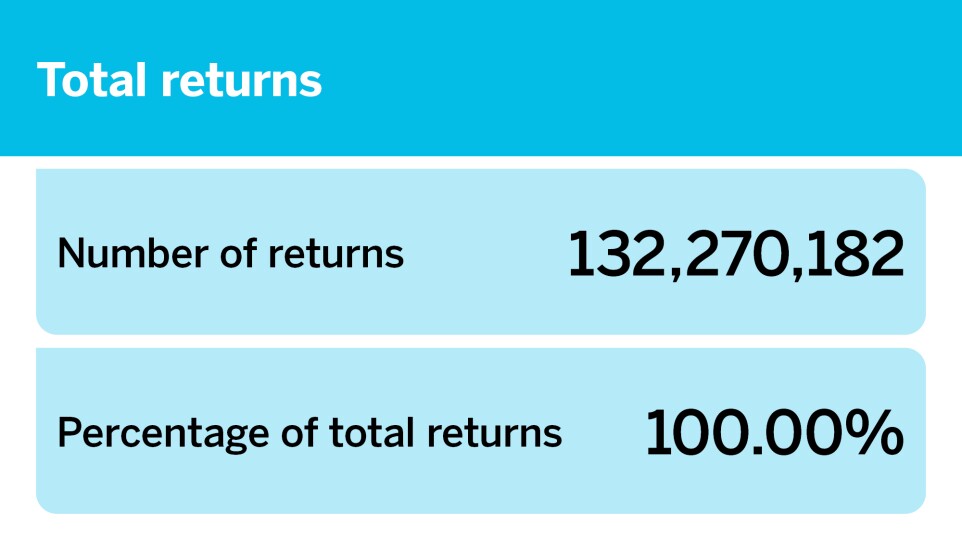
Tax season ended on April 15 and the six-month extension deadline is approaching in October. As of May 23, there were 132,270,182 total tax returns filed with the Internal Revenue Service. Measured by income group, those who made between $50,000 and $75,000 filed the most returns, at 15.69% of the total filed.  Those in the $1,000,000-or-more group filed only 0.22% of the total. 

Read more about the number of returns filed as of May 23 and see how they differ between income groups.

Source: IRS.gov

Number of tax returns by income group

Adjusted gross income

Number of returns

% of total returns

Total returns

132,270,182

100.00%

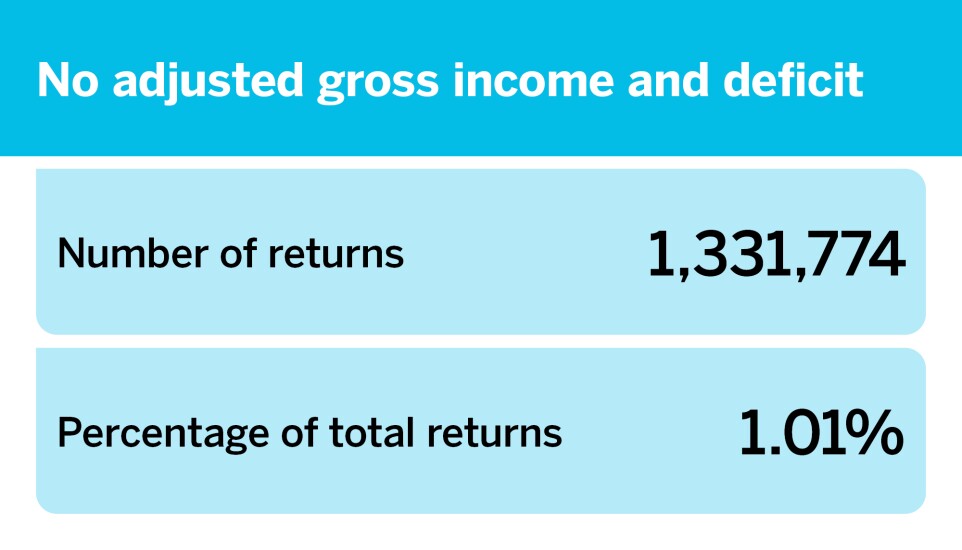
No adjusted gross income and deficit

1,331,774

1.01%

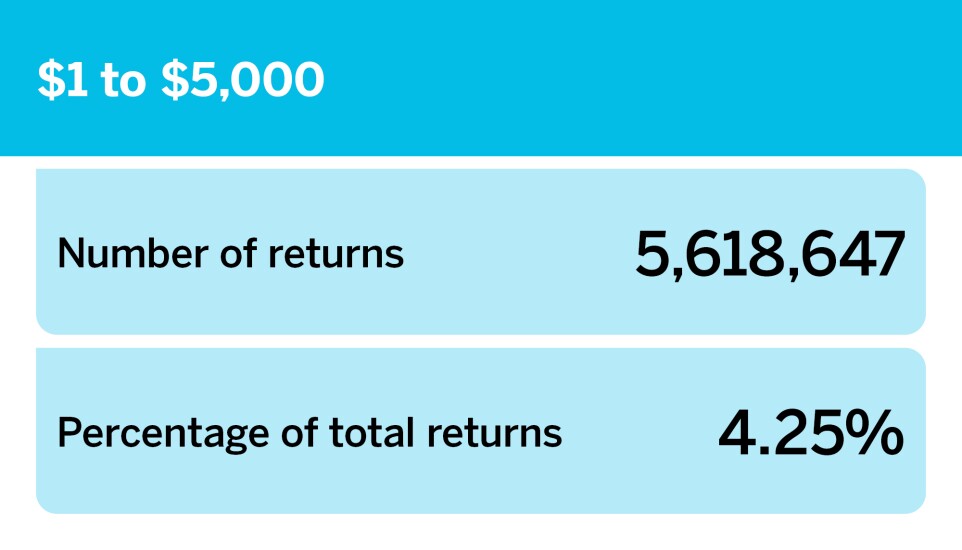
$1 to $5,000

5,618,647

4.25%

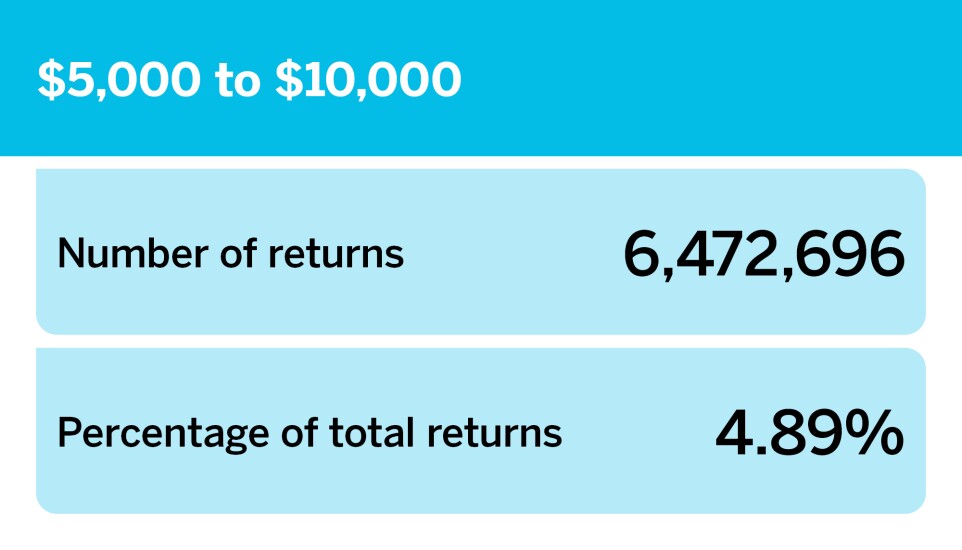
$5,000 to $10,000

6,472,696

4.89%

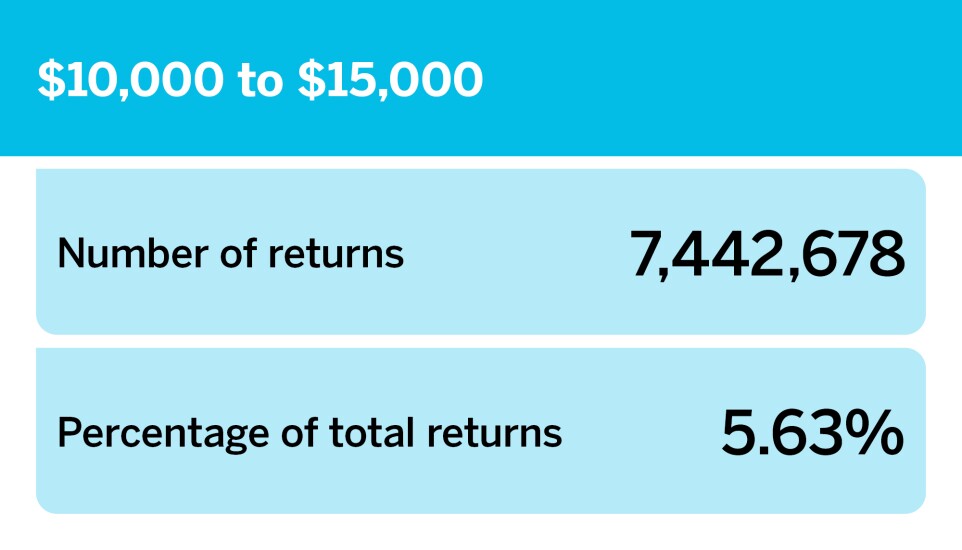
$10,000 to $15,000

7,442,678

5.63%

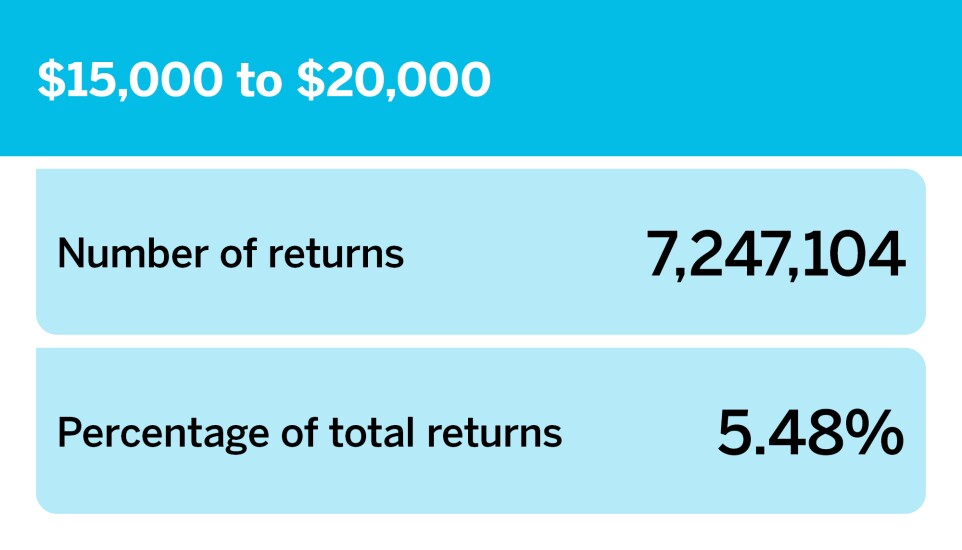
$15,000 to $20,000

7,247,104

5.48%

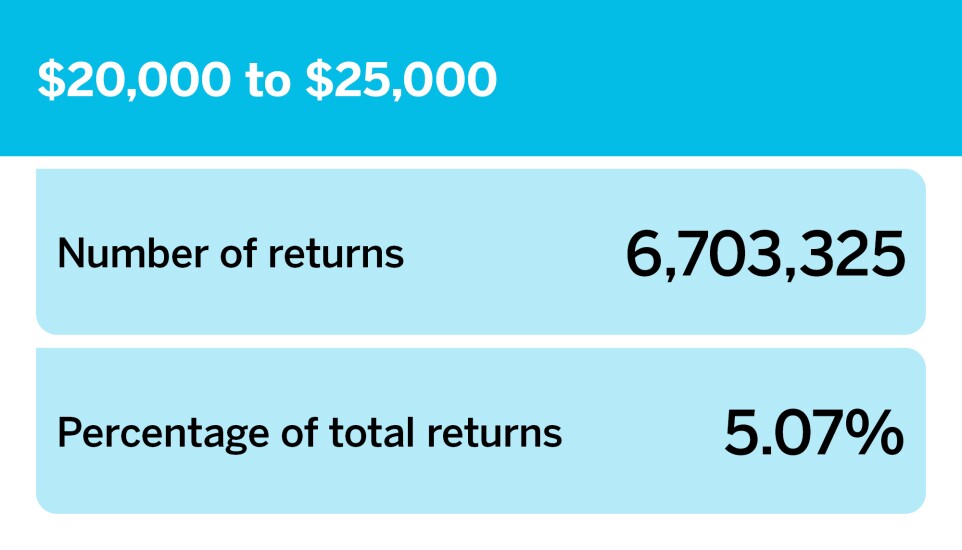
$20,000 to $25,000

6,703,325

5.07%

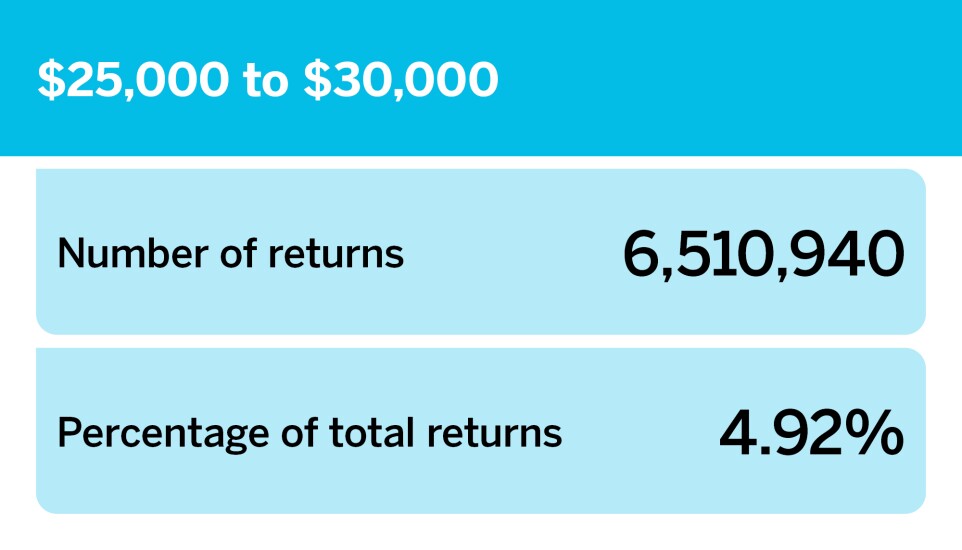
$25,000 to $30,000

6,510,940

4.92%

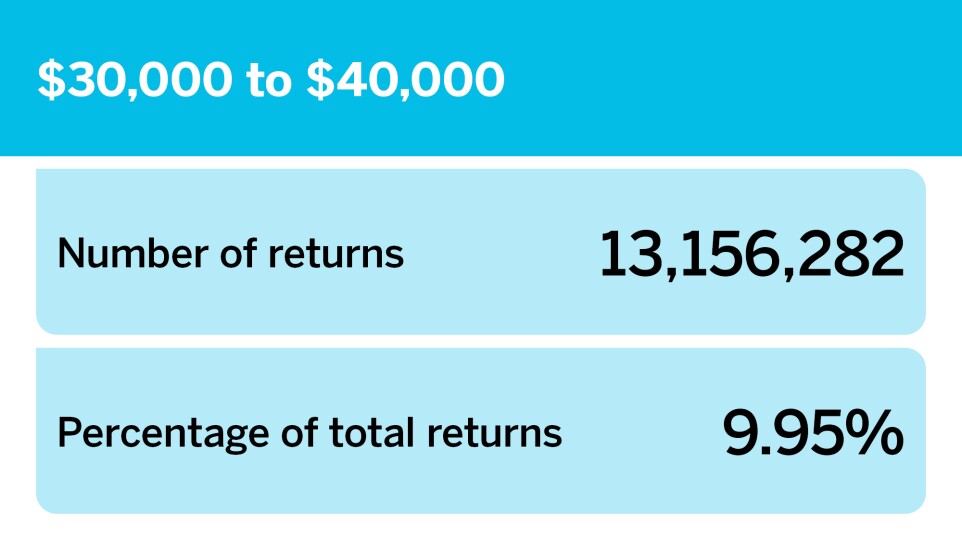
$30,000 to $40,000

13,156,282

9.95%

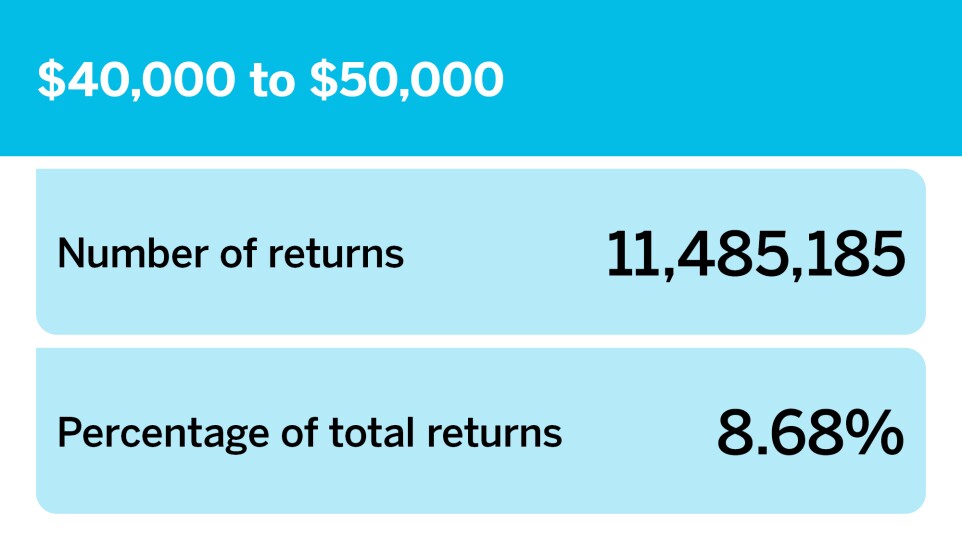
$40,000 to $50,000

11,485,185

8.68%

$50,000 to $75,000

20,751,406

15.69%

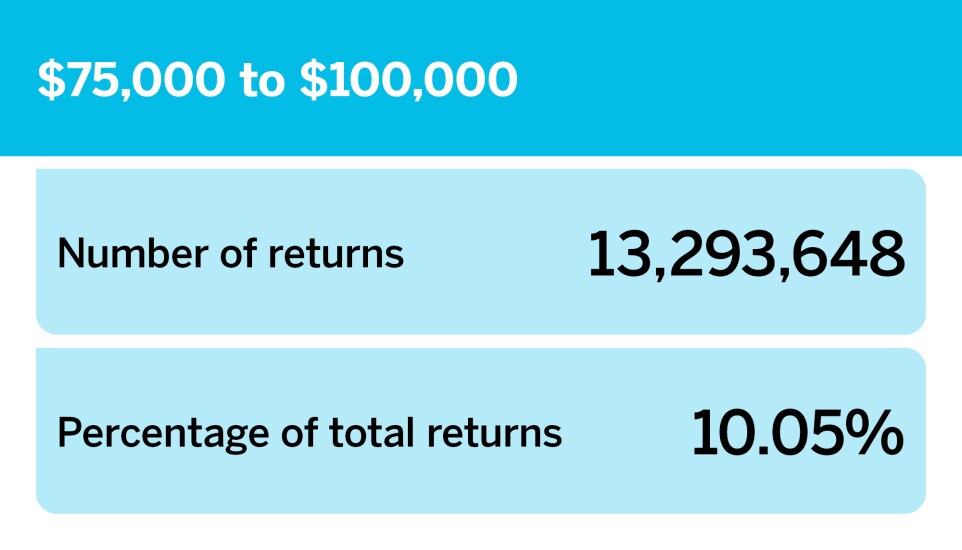
$75,000 to $100,000

13,293,648

10.05%

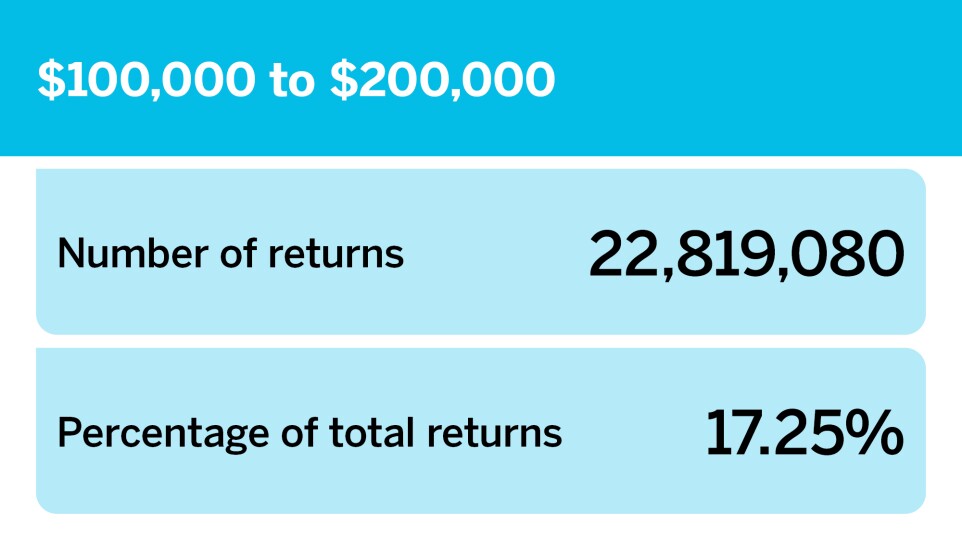
$100,000 to $200,000

22,819,080

17.25%

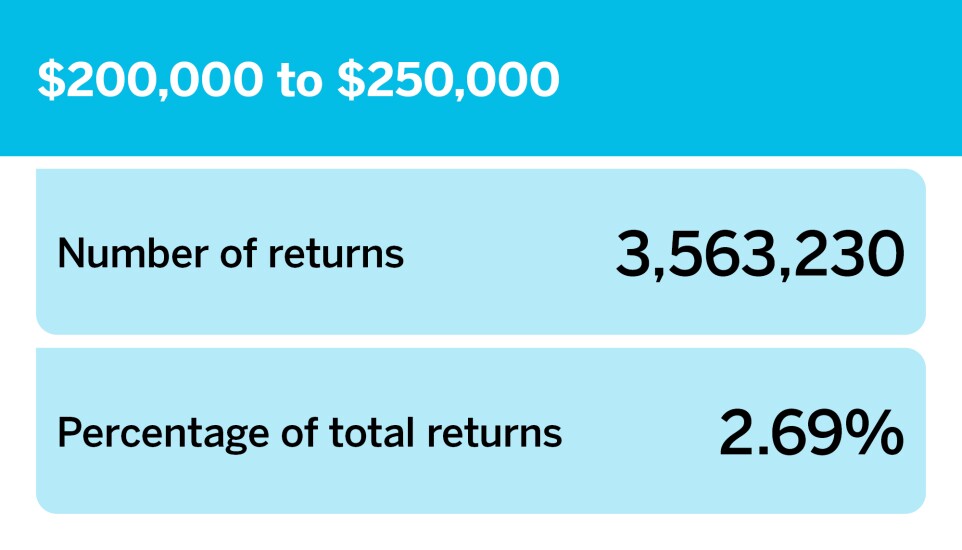
$200,000 to $250,000

3,563,230

2.69%

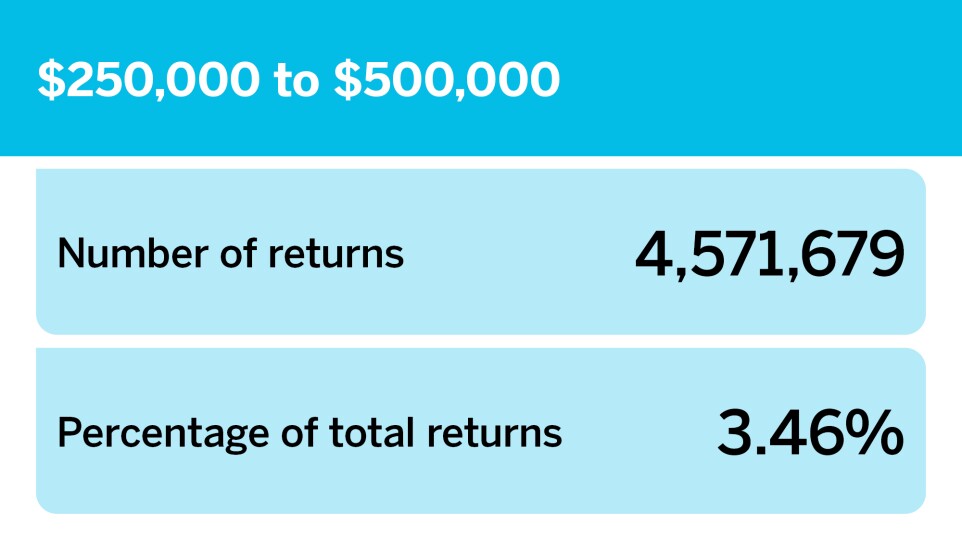
$250,000 to $500,000

4,571,679

3.46%

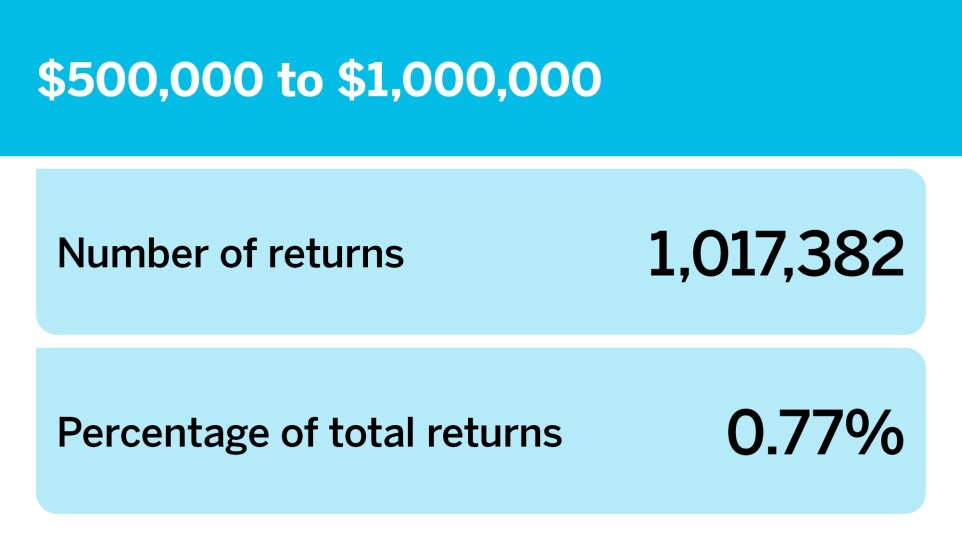
$500,000 to $1,000,000

1,017,382

0.77%

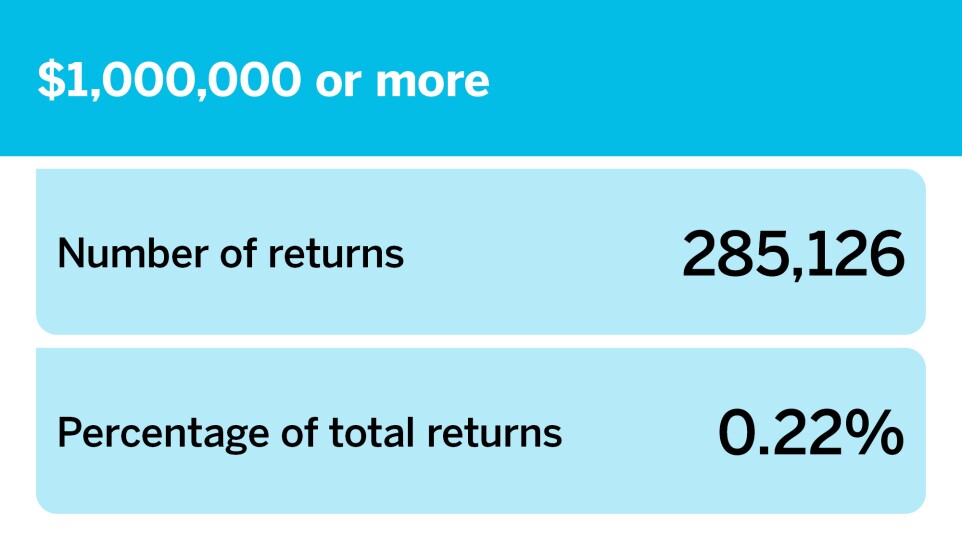
$1,000,000 or more

285,126

0.22%

Accounting Today_Number of returns by income group__17.jpg
Those who made $1,00,000 or more filed 285,126 returns.
Accounting Today_Number of returns by income group__16.jpg
Those who made between $500,000 and $1,000,000 filed 1,017,382 returns.
Accounting Today_Number of returns by income group__15.jpg
Those who made between $250,000 and $500,000 filed 4,571,679 returns.
Accounting Today_Number of returns by income group__14.jpg
Those who made between $200,000 and $250,000 filed 3,562,230 returns.
Accounting Today_Number of returns by income group__13.jpg
Those who made between $100,000 and $200,000 filed 22,819,080 returns.
Accounting Today_Number of returns by income group__12.jpg
Those who made between $75,000 and $100,000 filed 13,293,648 returns.
Accounting Today_Number of returns by income group__11.jpg
Those who made between $50,000 and $75,000 filed 20,751,406 returns.
Accounting Today_Number of returns by income group__10.jpg
Those who made between $40,000 and $50,000 filed 11,485,185 returns.
Accounting Today_Number of returns by income group__9.jpg
Those who made between $30,000 and $40,000 filed 13,156,282 returns.
Accounting Today_Number of returns by income group__8.jpg
Those who made between $25,000 and $30,000 filed 6,510,940 returns.
Accounting Today_Number of returns by income group__7.jpg
Those who made between $20,000 and $25,000 filed 6,703,325 returns.
Accounting Today_Number of returns by income group__6.jpg
Those who made between $15,000 and $20,000 filed 7,247,104 returns.
Accounting Today_Number of returns by income group__5.jpg
Those who made between $10,000 and $15,000 filed 7,442,678 returns.
Accounting Today_Number of returns by income group__4.jpg
Those who made between $5,000 and $10,000 filed 6,472,696 returns.
Accounting Today_Number of returns by income group__3.jpg
Those who made between $1 and $5,000 filed 5,618,647 returns.
Accounting Today_Number of returns by income group__2.jpg
Accounting Today_Number of returns by income group__.jpg
Tax
MORE FROM FINANCIAL PLANNING