As markets continue to experience the repercussions of the coronavirus pandemic, some clients are watching their long-term investments even closer than usual. And while outperformance is still more than attainable from their holdings in mutual funds, there is one caveat: Actively managed returns come at a price.
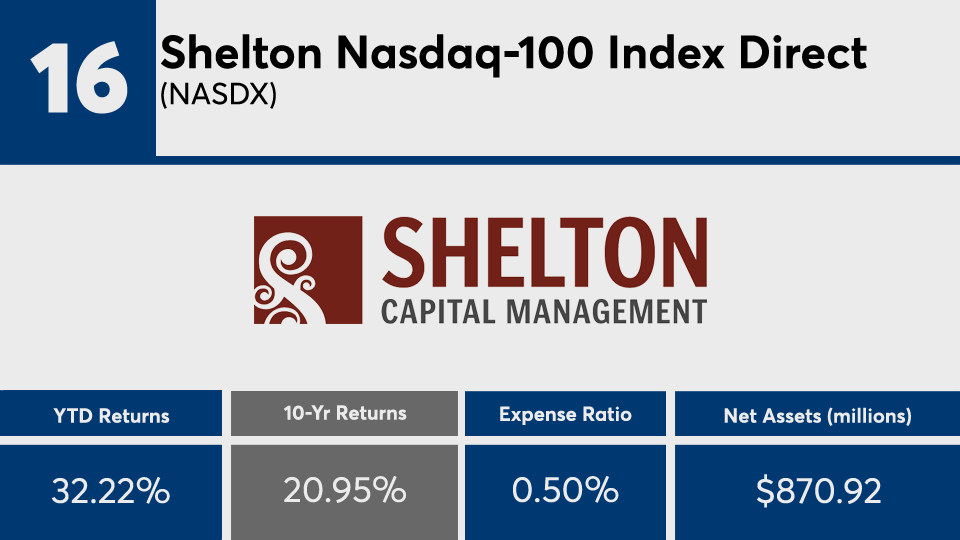
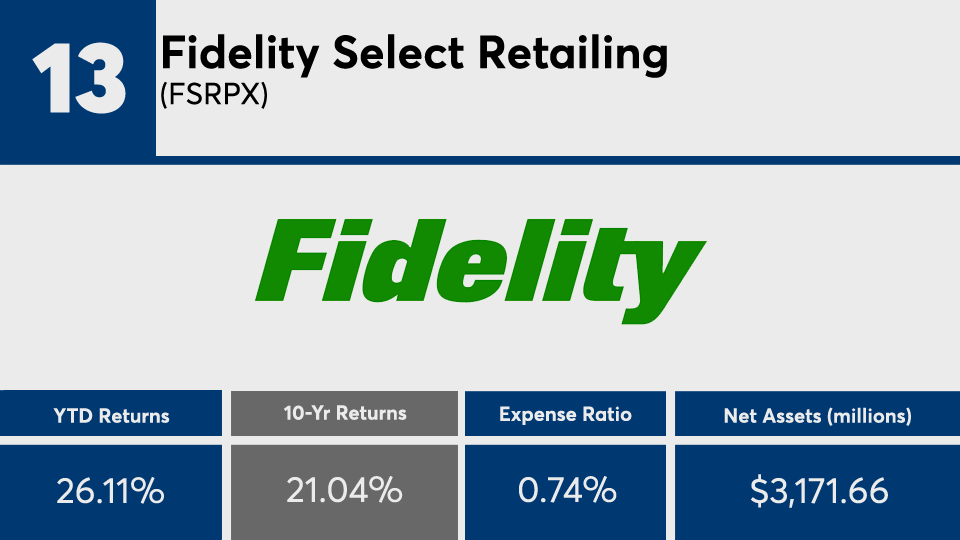
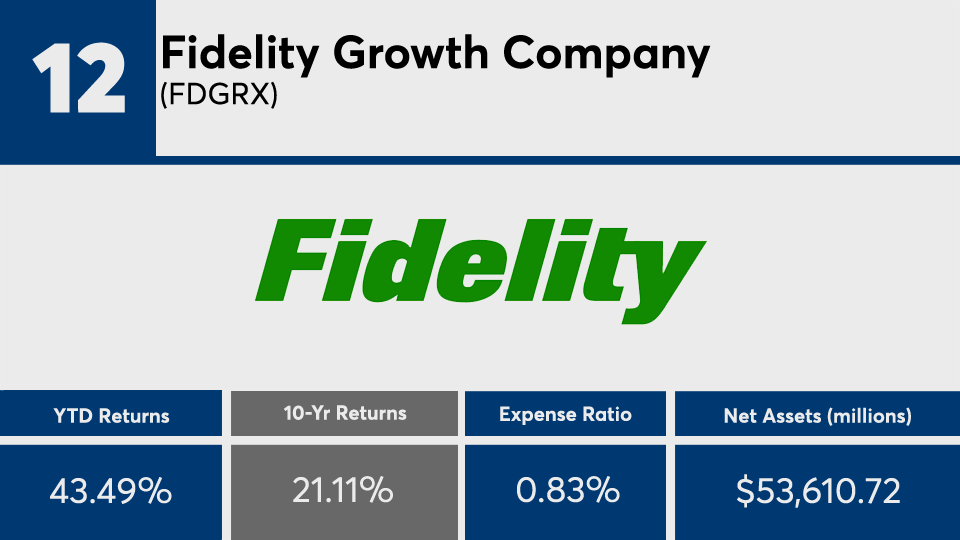
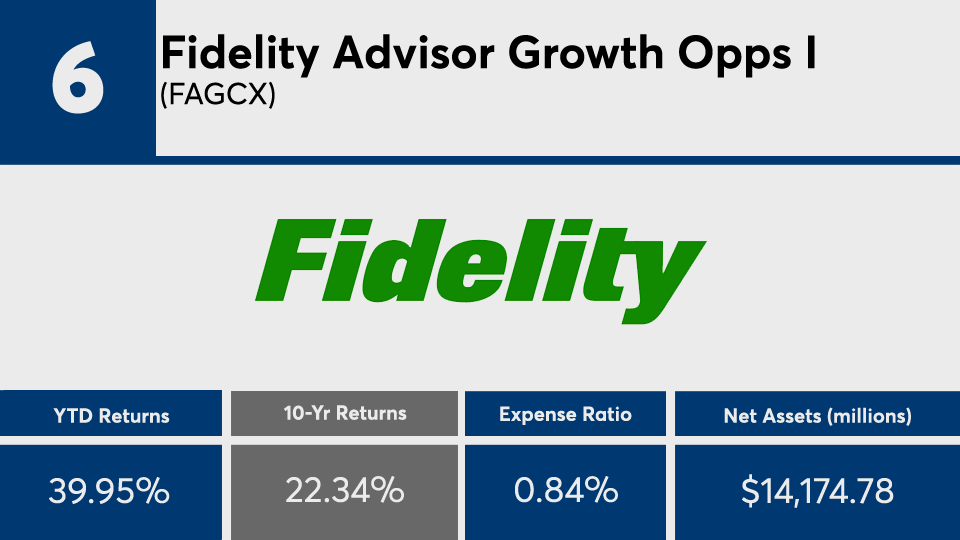
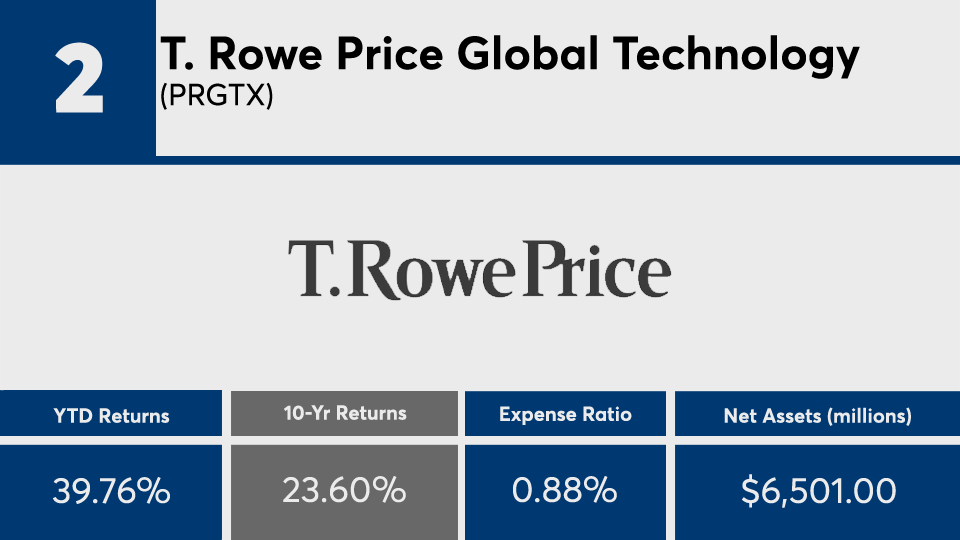
The 20 mutual funds with the biggest 10-year gains have an average net expense ratio nearly twice the industry average. The funds at the top sport an average gain of nearly 22% over the decade, well above index trackers such as the SPDR S&P 500 ETF Trust (SPY) and the SPDR Dow Jones Industrial Average ETF Trust (DIA), which have posted returns of 14.38% and 13.04%, respectively, according to Morningstar Direct data.
This year, the long-term leaders had an average gain of more than 36%, well above the broader indexes — SPY and DIA managed a YTD gain of 6.14% and loss of 1.33%, over the same period.
In bonds, the iShares Core U.S. Aggregate Bond ETF (AGG) has reported YTD and 10-year gains of 7.01% and 3.61%, respectively.
When considering the decade’s top-performers — most of which are either focused on technology or large-cap growth stocks — speaking with clients about diversification and relative gains is key, says Stephen Cavagnaro, director of private clients at Anchor Capital Advisors, a value-focused asset manager and wealth advisory firm based in Boston.
“Long-term performance and long-term stability are the most important factors,” Cavagnaro says. “Chasing one investment trend, whether via an individual company or sector, is not a viable long-term solution because it introduces too many risks.”
Fees among the lineup of actively managed funds, as expected, are high. Ranging from as much as 2.22%, their net average of 88 basis points came in well above the 0.45% investors paid on average for fund investing overall last year, according to
“Investors may not factor in the annual capital gains that are handed to them from mutual funds,” he says.
Scroll through to see the 20 mutual funds with the biggest 10-year gains through Aug. 20. Funds with less than $500 million in AUM and with investment minimums over $100,000 were excluded, as were leveraged and institutional funds. Assets and expense ratios, as well as YTD, one-, three-, five- and 10-year returns are listed for each. The data show each fund's primary share class. All data is from Morningstar Direct.


