As investors continue to seek the biggest bang for their buck, analysis of the lowest-cost funds in the industry show they may have been on the right track all along.
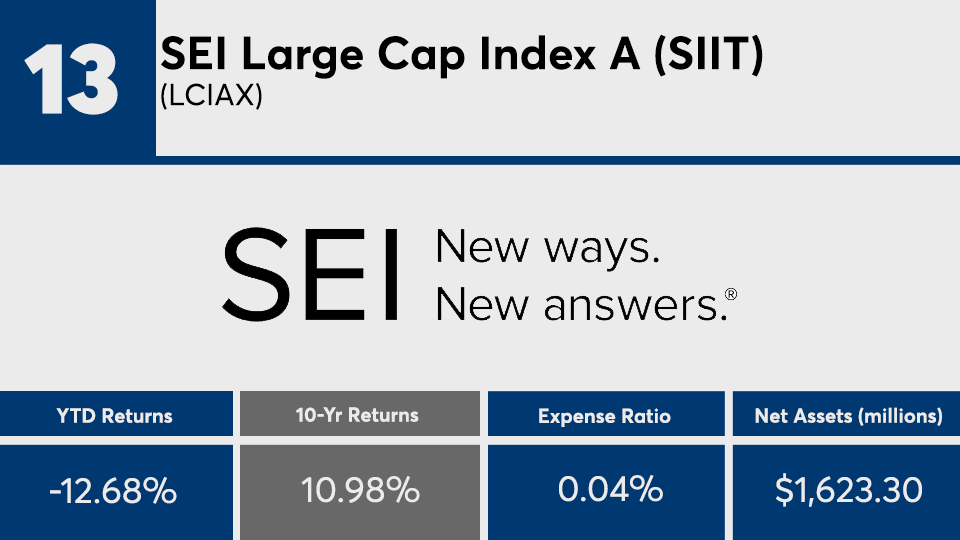
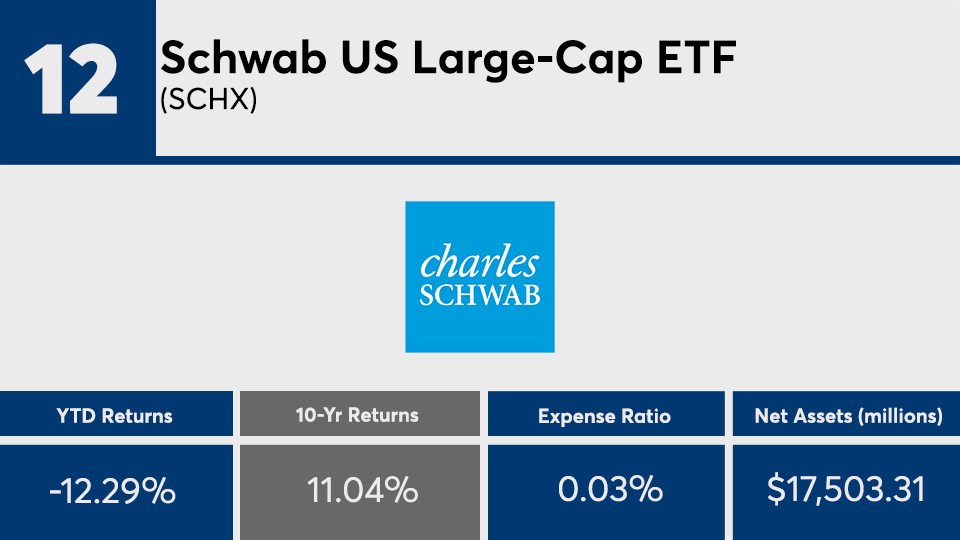
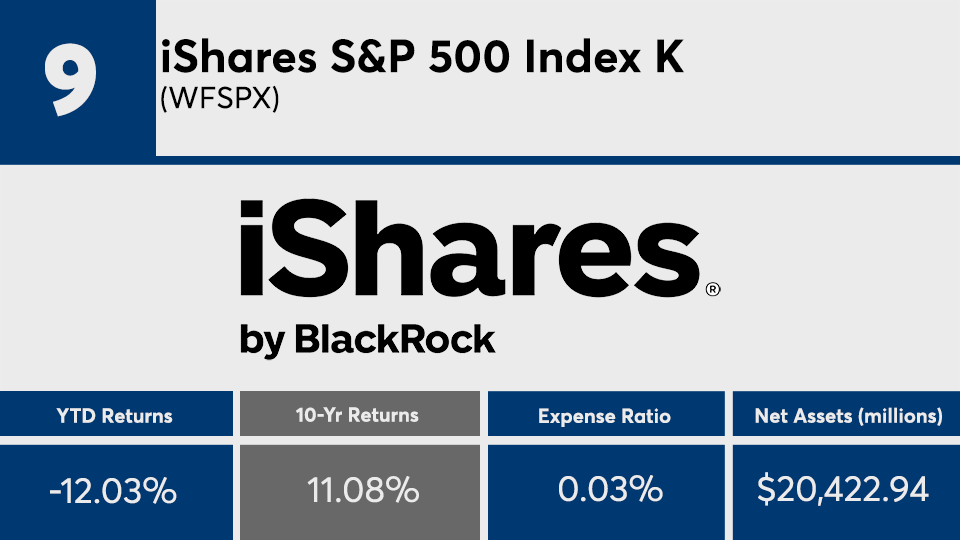
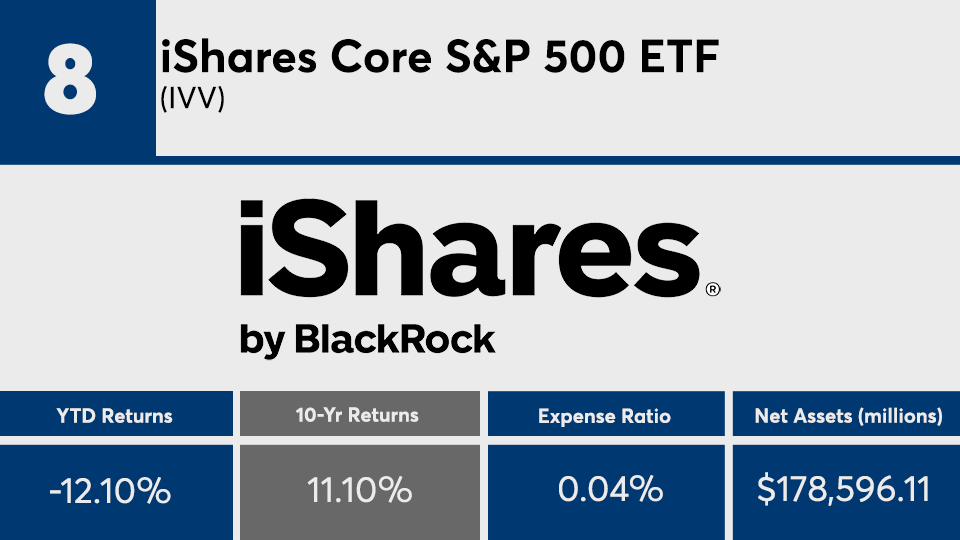
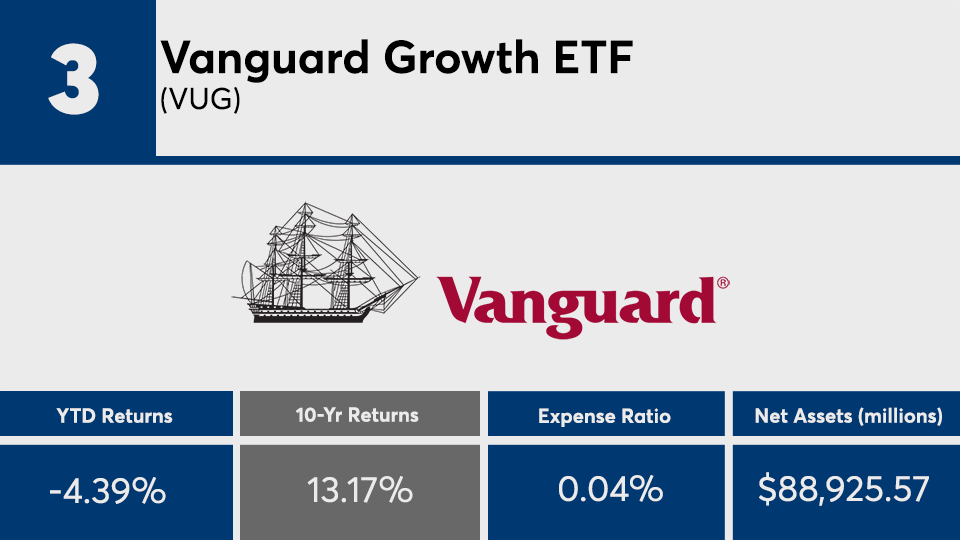
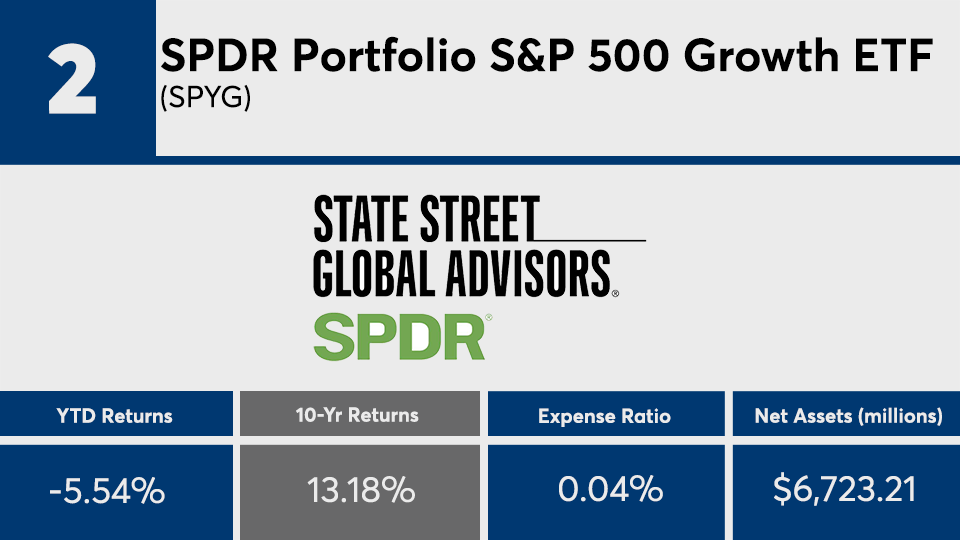
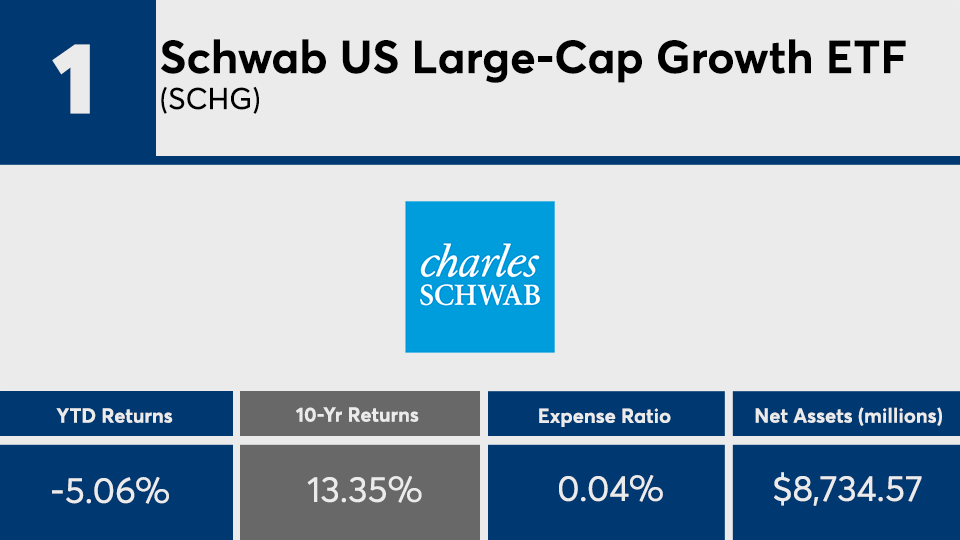
The 20 funds with the best 10-year returns and fees below 5 basis points — and with at least $500 million in assets under management — recorded an average gain of 11.43%, Morningstar Direct data show. That is higher than the Dow’s 10.12% gain, as measured by SPDR Dow Jones Industrial Average ETF Tracker (DIA), as well as the S&P’s 10.73% gain, as measured by the SPDR S&P 500 ETF Trust (SPY), over the same period.
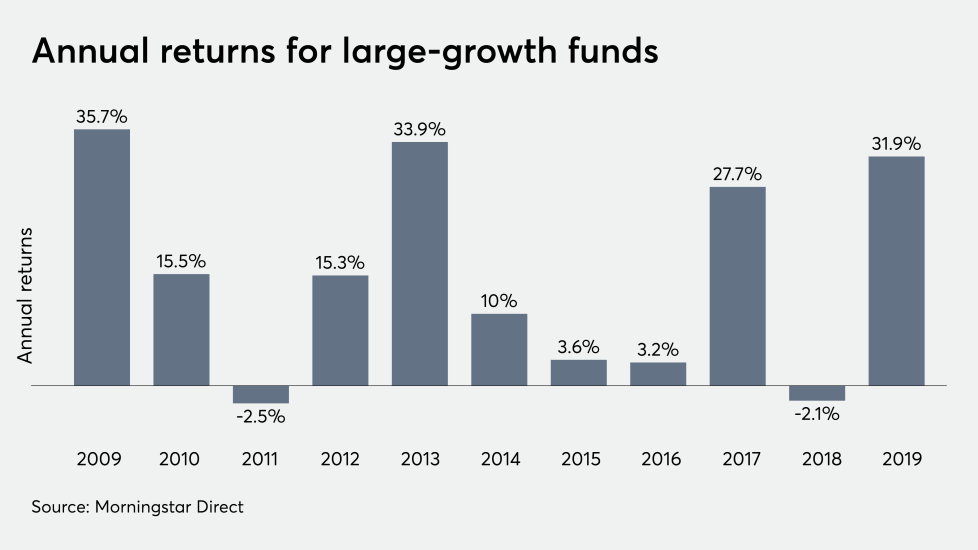
“When you look at the top four, they’re virtually all the same fund,” notes Marc Pfeffer, CIO of CLS Investments. “They’re all large-cap growth funds; that’s been the best place to be. When you look at the top holdings for those funds, you will see the same names, as well.”
Despite generating an overall loss of more than 10% so far this year, these funds also outpaced the major indexes year-to-date. To be sure, the Dow and S&P recorded YTD losses of 18.16% and 17.08%, respectively, data show.
The average fee among the top-performers here is, as imagined, extremely low. With an average net expense ratio of just 3 basis points, the funds are significantly lower than the 0.48% investors paid on average for fund investing last year, according to Morningstar’s most recent annual fee survey, which reviewed the asset-weighted average expense ratios of all U.S. open-end mutual funds and ETFs.
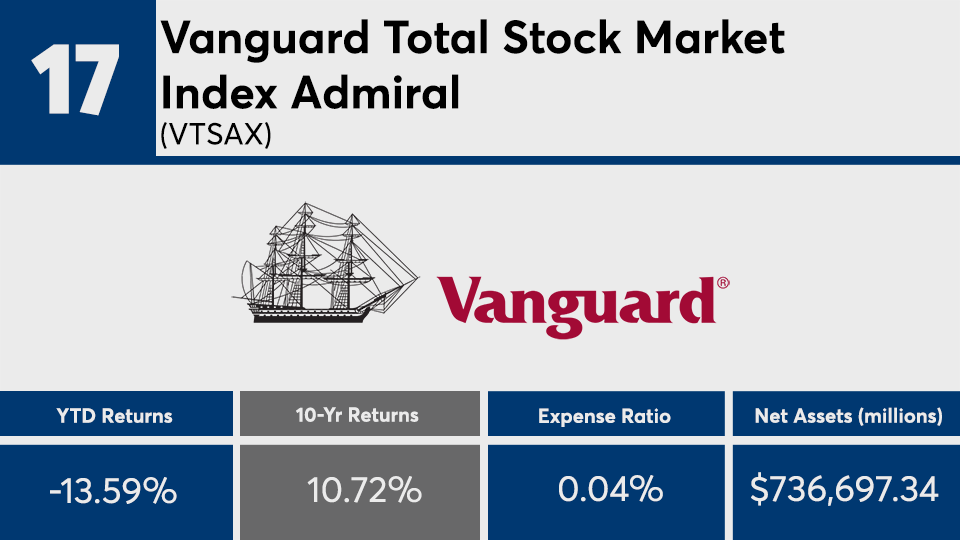
The industry’s largest overall fund, the $736.7 billion Vanguard Total Stock Market Index Fund (VTSAX), is also among the top-performing, data show. With a 0.04% expense ratio, the fund generated a 10-year gain of 10.72% and YTD loss of 13.59%. On the bond side, the industry’s largest overall fixed-income fund — the $259.3 billion Vanguard Total Bond Market Index Fund (VBTLX) — has a 0.50% expense ratio and notched a 10-year gain of 3.96% and YTD gain of 5.15%.
“Historically, stocks that have dominated over a 10-year time frame don’t necessarily dominate over the next 10-year time frame,” Pfeffer says, adding that the holdings in these top-performers, “are companies that will be replaced, from a performance standpoint, over the next decade. While this is great looking at analysis over the long-term here, I would not expect all of these names to remain at the top over the next 10 years.”
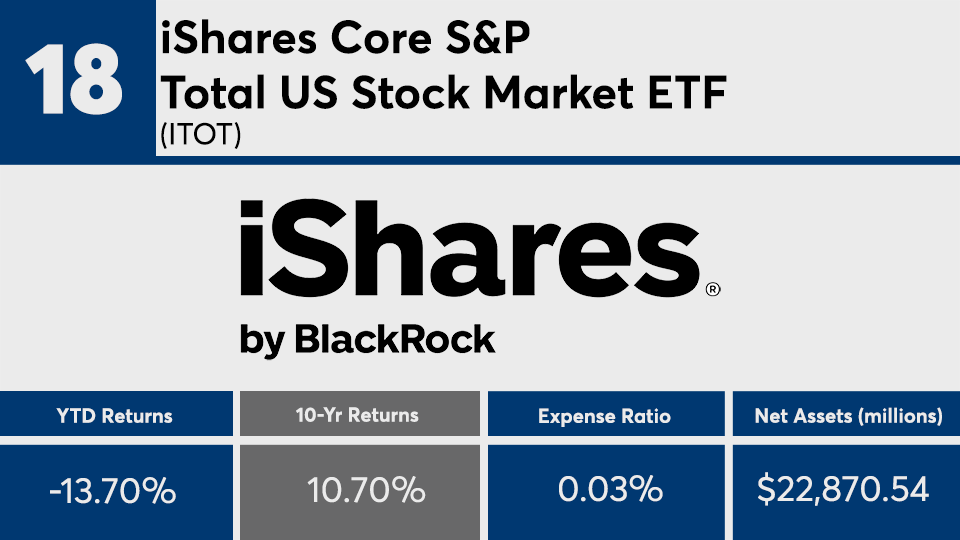
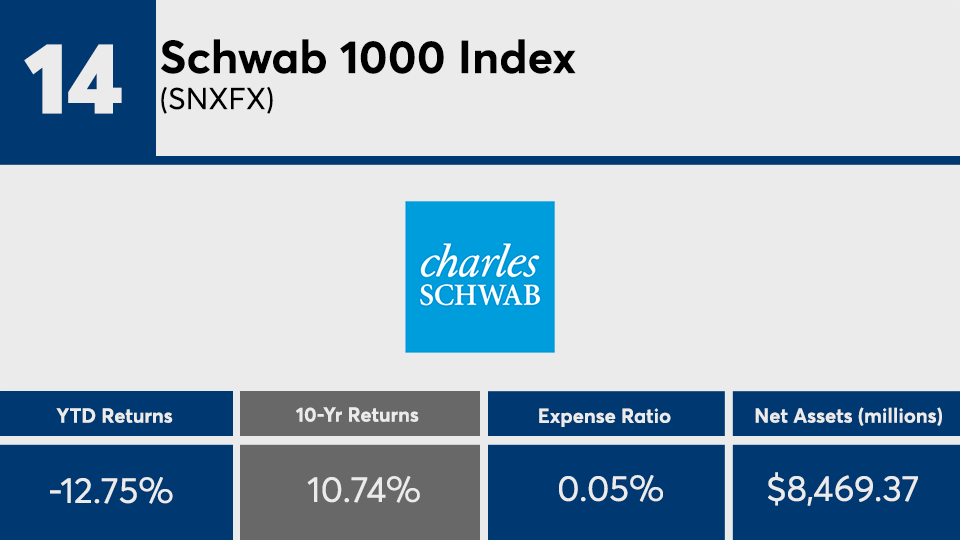
Scroll through to see the 20 mutual funds and ETFs with fees below 0.05% and the biggest 10-year returns through April 14. Funds with less than $500 million in AUM and investment minimums over $100,000 were excluded, as were leveraged and institutional funds. Assets and expense ratios, as well as year-to-date, one-, three-, five- and 10-year returns are listed for each. The data show each fund's primary share class. All data is from Morningstar Direct.
