Best performing fund sectors of the decade

Long-term gains of the fund industry’s top-performing sectors show why portfolio diversity is mission critical.

Home to a combined $9.99 trillion in combined assets, the 20 fund categories with the biggest returns of the past 10 years generated an average gain of less than 12%, undershooting some of the industry’s largest index trackers, Morningstar Direct data show.

This year, the same sectors — as defined by Morningstar — had an average gain of nearly 25%.

“When I look as these numbers, like technology for instance, I think ‘It's great, but can it continue to produce,’” says Pacer ETFs President Sean O'Hara, adding that “the hardest conversation to have with a client is how to make their expectations and goals align with how their portfolio is invested.”

Pitting these sectors against the broader fund universe, trackers such as the SPDR S&P 500 ETF Trust (SPY) and the SPDR Dow Jones Industrial Average ETF Trust (DIA) delivered 10-year gains of 13.7% and 12.55%, respectively, data show. Over the last year, SPY and DIA had returns of 17.79% and 8.9%, respectively.

In bonds, the iShares Core U.S. Aggregate Bond ETF (AGG) recorded gains of 5.27 and 3.67% over the one- and 10-year periods, data show.

Overall, the best-performing categories carried fees well above the industry average. Sectors such as Foreign Small/Mid Growth and World Small/Mid Stock were among the priciest with overall expense ratios above 130 basis points, while two target-date fund sectors in the ranking were less than 0.75%, data show. As a whole, fees averaged around 1.11%, more than twice the 0.45% investors paid for fund investing in 2019, according to Morningstar’s most recent annual fee survey.

A conversation with clients about the performance and characteristics of individual sectors can help provide necessary context when considering short-term market fluctuations and trendy stocks, O’Hara explains.

“We have to manage a client’s goals and expectations,” he says. “When you have inevitable declines, fear takes over; and when you have an up market, greed takes over. That’s the biggest challenge for an advisor.”

Scroll through to see the 20 Morningstar categories with the biggest 10-year annualized gains. Assets and average expense ratios, as well as one-, three- and five-year returns through Jan. 28 are also listed for each. Data is derived from the primary share classes of mutual funds and ETFs in each category. All data is from Morningstar Direct.

FP020121_20 copy.png

Target-Date 2045

3-Yr. Annualized Return: 8%
5-Yr. Annualized Return: 13.49%
FP020121_19 copy.png

World Small/Mid Stock

3-Yr. Annualized Return: 9.95%
5-Yr. Annualized Return: 16.13%
FP020121_18 copy.png

Foreign Small/Mid Growth

3-Yr. Annualized Return: 8.22%
5-Yr. Annualized Return: 14.93%
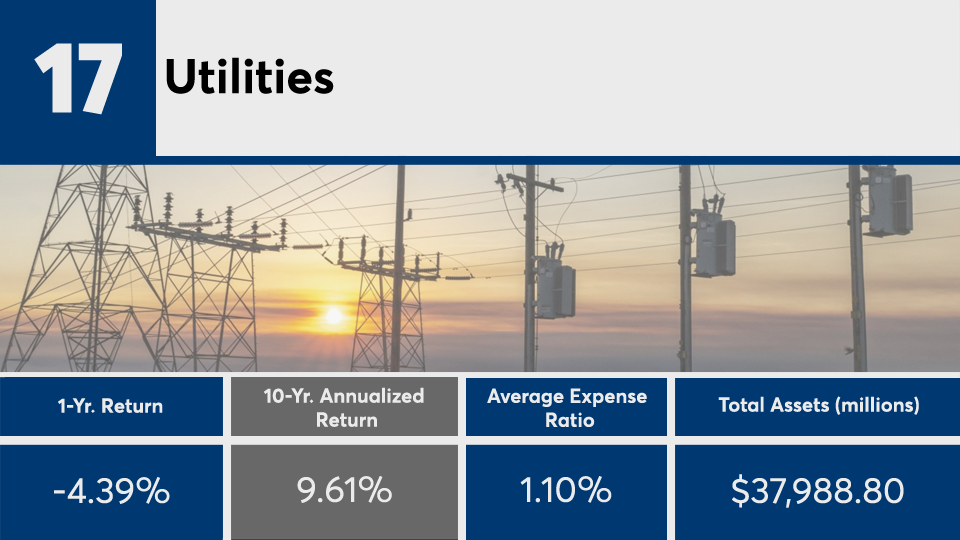
FP020121_17 copy.png

Utilities

3-Yr. Annualized Return: 8.36%
5-Yr. Annualized Return: 10.05%
FP020121_16 copy.png

Target-Date 2055

3-Yr. Annualized Return: 8.09%
5-Yr. Annualized Return: 13.75%
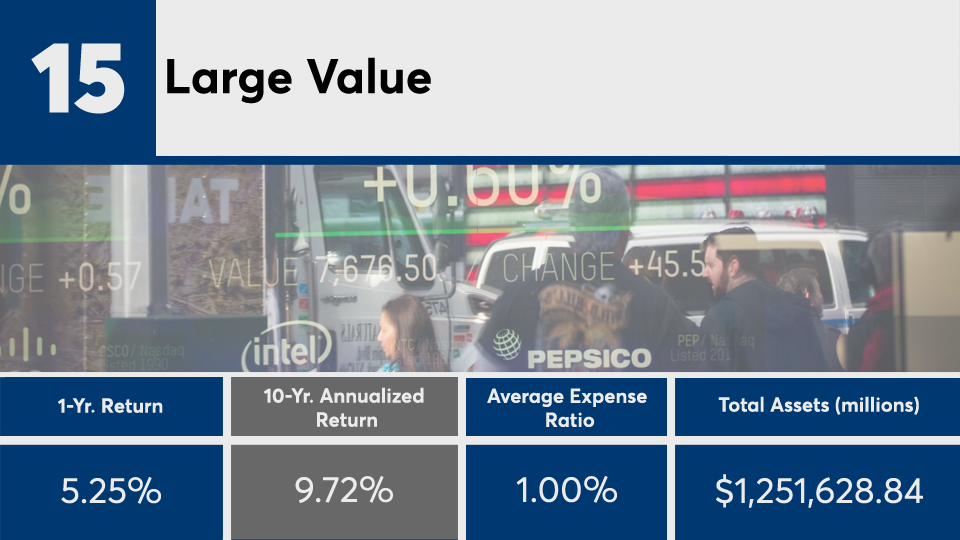
FP020121_15 copy.png

Large Value

3-Yr. Annualized Return: 3.92%
5-Yr. Annualized Return: 11.43%
FP020121_14 copy.png

Allocation — 85%+ Equity

3-Yr. Annualized Return: 7.81%
5-Yr. Annualized Return: 13.25%
FP020121_13 copy.png

Communications

3-Yr. Annualized Return: 11.18%
5-Yr. Annualized Return: 13.59%
FP020121_12 copy.png

Small Blend

3-Yr. Annualized Return: 6.63%
5-Yr. Annualized Return: 13.94%
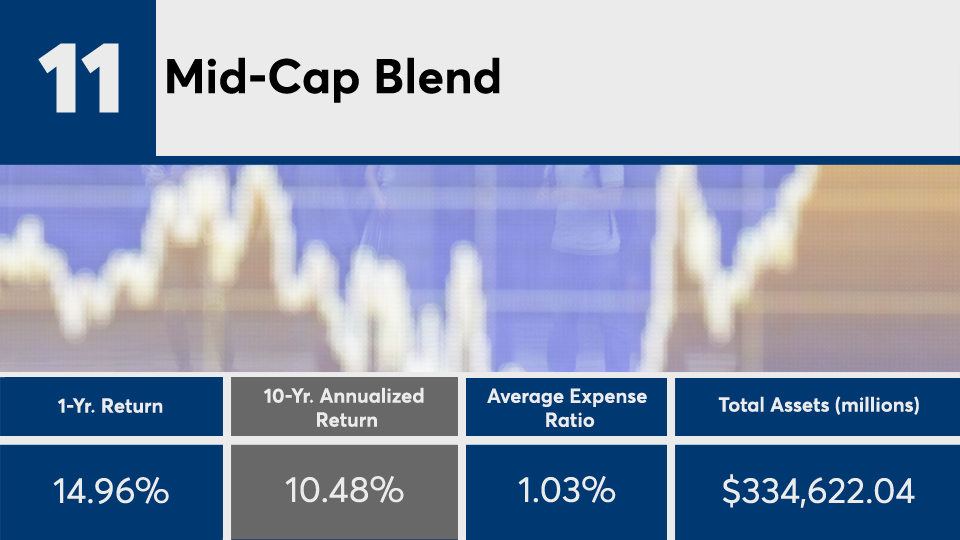
FP020121_11 copy.png

Mid-Cap Blend

3-Yr. Annualized Return: 7.17%
5-Yr. Annualized Return: 13.75%
FP020121_10 copy.png

Convertibles

3-Yr. Annualized Return: 18.34%
5-Yr. Annualized Return: 17.97%
FP020121_9 copy.png

Industrials

3-Yr. Annualized Return: 5.55%
5-Yr. Annualized Return: 15.32%
FP020121_8 copy.png

Consumer Defensive

3-Yr. Annualized Return: 6.98%
5-Yr. Annualized Return: 9%
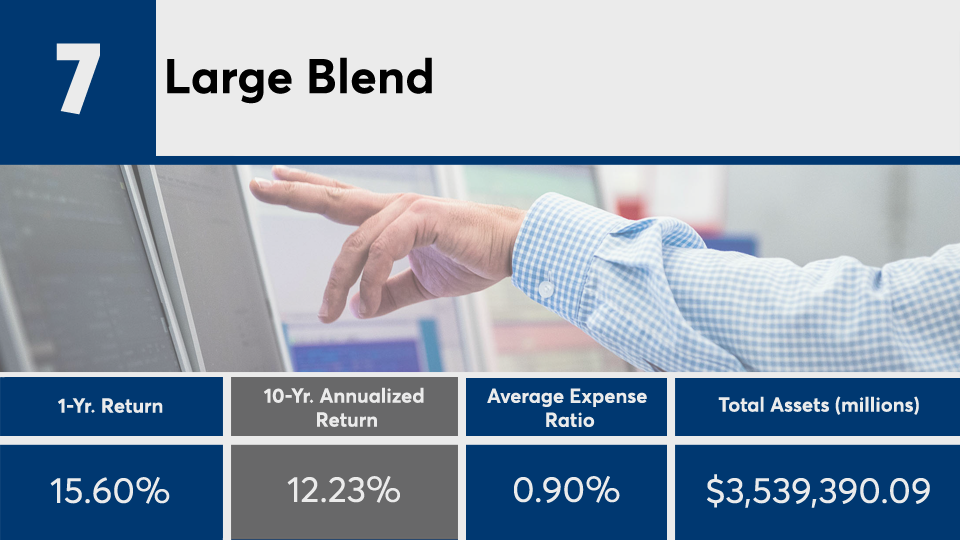
FP020121_7 copy.png

Large Blend

3-Yr. Annualized Return: 9.66%
5-Yr. Annualized Return: 15.46%
FP020121_6 copy.png

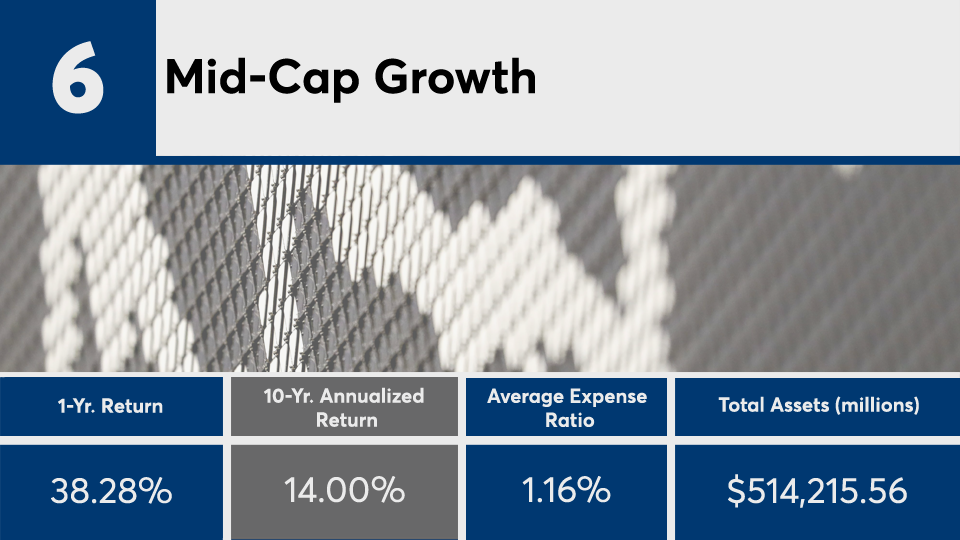
Mid-Cap Growth

3-Yr. Annualized Return: 17.81%
5-Yr. Annualized Return: 21.07%
FP020121_5 copy.png

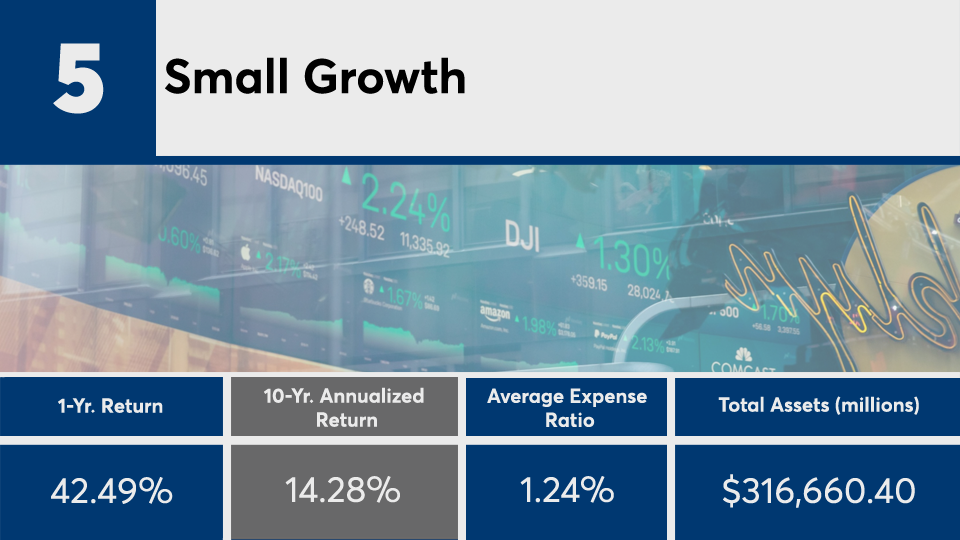
Small Growth

3-Yr. Annualized Return: 18.49%
5-Yr. Annualized Return: 22.12%
FP020121_4 copy.png

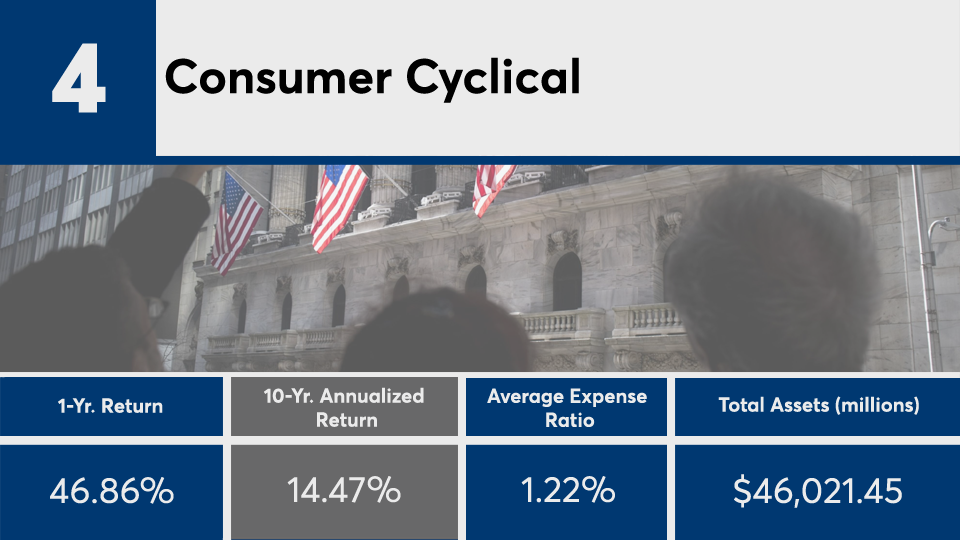
Consumer Cyclical

3-Yr. Annualized Return: 14.55%
5-Yr. Annualized Return: 17.13%
FP020121_3 copy.png

Large Growth

3-Yr. Annualized Return: 17.42%
5-Yr. Annualized Return: 20.79%
FP020121_2 copy.png

Health

3-Yr. Annualized Return: 13.5%
5-Yr. Annualized Return: 16.53%
FP020121_1 copy.png

Technology

3-Yr. Annualized Return: 24.82%
5-Yr. Annualized Return: 29.39%
MORE FROM FINANCIAL PLANNING