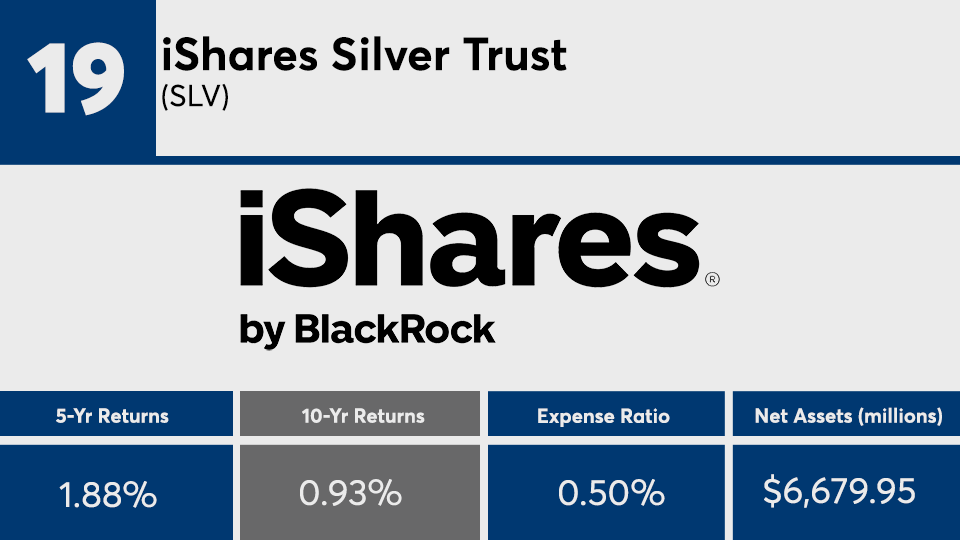
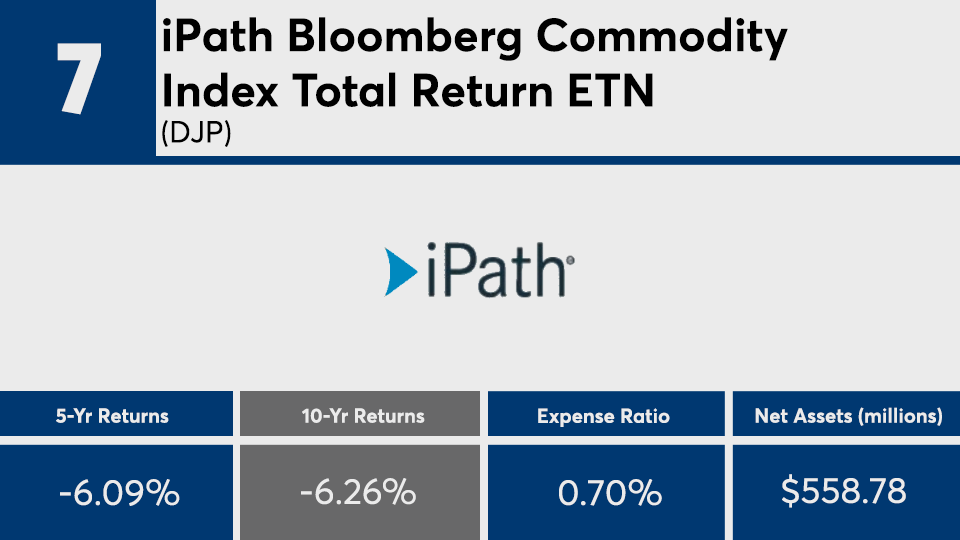
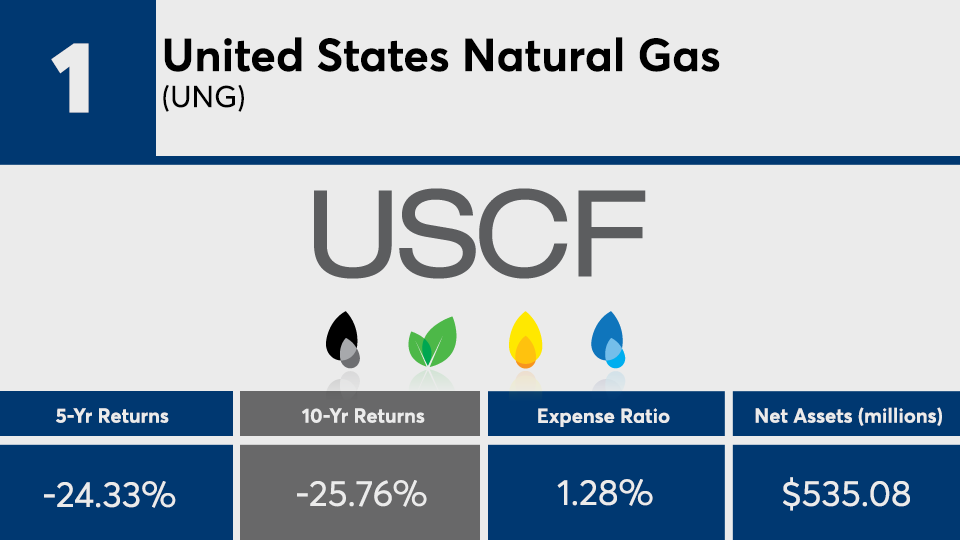
Long on oil? Short the Nasdaq? These were just two of the losing strategies behind the decade’s worst-performing index funds.
The 20 index funds with the worst 10-year return figures — and at least $500 million in assets under management — had an average loss of more than 5%, Morningstar Direct data show.
“The shift in investor preferences over the past decade has resulted in numerous casualties,” Morningstar research analysts Kevin McDevitt and Nick Watson wrote in a paper on 2019 fund flows earlier this year, adding, “Three of the biggest were allocation, alternative and sector equity funds.”
Broad-basket commodity sector funds, as well as those tracking energy and precious metals, accounted for more than half of the decade’s worst-performers, data show. Ultrashort bond funds and funds with large allocations to Latin American and Russian equities made the list, as well.
The ranking, led by commodity and inverse equity ETFs, underperformed the S&P 500’s 13.19% gain, as tracked by SPDR S&P 500 ETF Trust (SPY), as well as the 12.73% gain by the Dow, as measured by the SPDR Dow Jones Industrial Average ETF Trust (DIA), data show. On the fixed-income side, the Bloomberg Barclays U.S. Aggregate Bond Index posted a 10-year gain of 3.77%, as measured by the iShares Core US Aggregate Bond ETF (AGG).
At least one expected commonality among these poor performers is their high fees. At more than 10 basis points pricier than their peers, these funds carried an average net expense ratio of 0.60% — well above the 0.48% industry average, according to Morningstar’s most recent annual fee survey, which reviewed the asset-weighted average expense ratios of all U.S. open-end mutual funds and ETFs.
The industry’s largest overall fund, the $901.9 billion Vanguard Total Stock Market Index Fund Admiral Shares (VTSAX), carried a 0.14% expense ratio and a 13.49% return over 10 years, data show.
“It's hard to know which funds will win out in the short run,” wrote Alex Bryan, Morningstar’s director of passive strategies for North America in an analysis of the research company's analyst ratings. “A strong investment process and low fee should pay off over the long term.”
Scroll through to see the 20 index funds with the worst returns over 10 years through Feb. 20. Funds with investment minimums over $100,000 were excluded, as were leveraged and institutional funds. Assets and expense ratios are listed for each, as well as year-to-date, one-, three- and five-year returns. The data show each fund's primary share class. All data from Morningstar Direct.


