These are the 20 biggest index funds with the best 10-year returns

There aren’t many advisors without clients in at least one of these funds.

Home to more than $123 billion in combined assets under management, the industry’s 20 largest index mutual funds and ETFs have generated an overall 10-year gain of more than 10%, Morningstar data show. In the past year, the lineup of both stock and bond funds have an average return of over 46%.

Aside from their rock-bottom fees, the funds in this lineup have at least one more thing in common: their holdings.

“What’s driving the top-performing funds over the last decade is very simple,” says industry consultant Marc Pfeffer. “When you look at the top three funds, their holdings are the same. It's just the magnitude between them: Apple, Amazon and Microsoft.”

With $357.7 billion in AUM, the SPDR S&P 500 ETF Trust (SPY) is by far the industry’s largest. Like its peers, the fund has a near-zero expense ratio of 0.02%. Overall, the funds in this lineup have an average fee of roughly 10 basis points. That’s roughly 35 basis points less than the 0.45% investors paid for fund investing in 2019, according to Morningstar’s most recent annual fee survey.

Although their fees have been attractive to investors over the years, Steve Skancke, chief economic advisor at Keel Point, says their asset allocation has been the key determinant of overall outperformance.

“Advisors are trained to evaluate and allocate based on the outlook for investment classes,” Skancke says. “At the same time, a simple basket of index funds can generate performance and outperform individually managed portfolios.”

When speaking with clients, Pfeffer say, it’s critical to show how funds’ short-term gains can boost their long-term figures, and what that may mean for future expectations.

“While the last decade has been very unfavorable for those funds that have been in international markets, if this had been done for the decade prior, these numbers would look different,” Pfeffer says. “There’s just no guarantee that what's worked for the last decade will work for the next.”

Scroll through to see the 20 largest index funds by net assets with the biggest 10-year annualized returns through April 22. Average expense ratios, as well as YTD, one-, three-, five- and 15-year returns and month-end share class flows through April 1 are also listed. The data show each fund's primary share class. All data is from Morningstar Direct.

FP042621_20 copy.png
YTD Return: -5.58%; 3-Yr. Annualized Return: 9.74%; 5-Yr. Annualized Return: 7.11%; 15-Yr. Annualized Return: 6.85%; YTD Net Flow: (millions): ($8,813.54); 1-Yr. Net Flow (millions): $3,655.24; 3-Yr. Net Flow (millions): $10,521.02; 5-Yr. Net Flow (millions): $12,829.59; 10-Yr. Net Flow (millions): ($2,556.62); 15-Yr. Net Flow (millions): $21,988.56; Inception Date: Nov. 18, 2004
FP042621_19 copy.png
YTD Return: 4.88%; 3-Yr. Annualized Return: 7.26%; 5-Yr. Annualized Return: 11.33%; 15-Yr. Annualized Return: 5.19%; YTD Net Flow: (millions): $4,704.76; 1-Yr. Net Flow (millions): $3,395.64; 3-Yr. Net Flow (millions): $4,241.26; 5-Yr. Net Flow (millions): $21,251.87; 10-Yr. Net Flow (millions): $26,117.79; 15-Yr. Net Flow (millions): $63,911.88; Inception Date: March 4, 2005
FP042621_18 copy.png
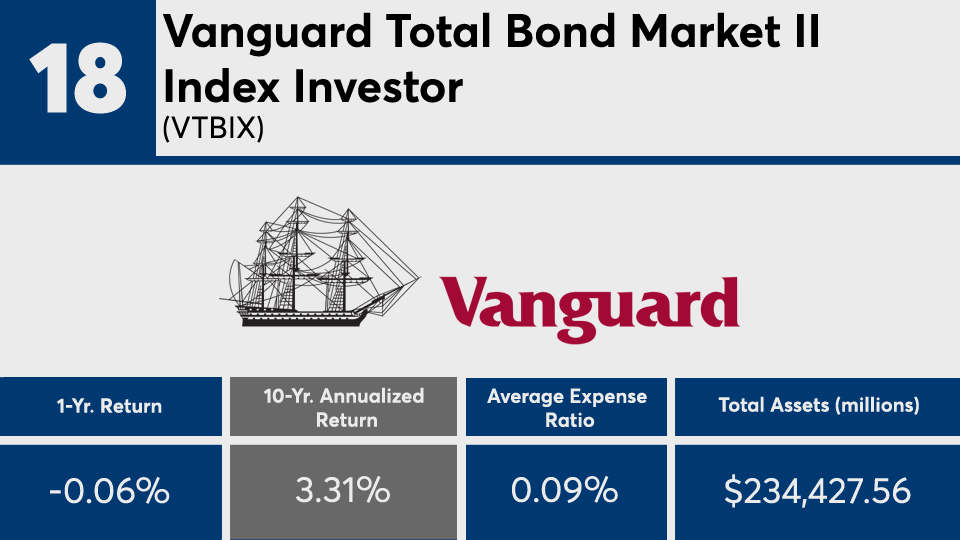
YTD Return: -2.57%; 3-Yr. Annualized Return: 5.14%; 5-Yr. Annualized Return: 3.17%; 15-Yr. Annualized Return: N/A; YTD Net Flow: (millions): 1$1,465.59; 1-Yr. Net Flow (millions): $34,068.75; 3-Yr. Net Flow (millions): $30,304.24; 5-Yr. Net Flow (millions): $63,622.05; 10-Yr. Net Flow (millions): $84,243.57; 15-Yr. Net Flow (millions): N/A; Inception Date: Jan. 26, 2009
FP042621_17 copy.png
YTD Return: -2.41%; 3-Yr. Annualized Return: 5.25%; 5-Yr. Annualized Return: 3.26%; 15-Yr. Annualized Return: 4.26%; YTD Net Flow: (millions): $2,389.70; 1-Yr. Net Flow (millions): $17,553.40; 3-Yr. Net Flow (millions): $26,476.04; 5-Yr. Net Flow (millions): $47,946.04; 10-Yr. Net Flow (millions): $71,012.56; 15-Yr. Net Flow (millions): $77,368.82; Inception Date: Sept. 22, 2003
FP042621_16 copy.png
YTD Return: -2.47%; 3-Yr. Annualized Return: 5.32%; 5-Yr. Annualized Return: 3.31%; 15-Yr. Annualized Return: 4.36%; YTD Net Flow: (millions): $196.33; 1-Yr. Net Flow (millions): $5,992.02; 3-Yr. Net Flow (millions): $20,458.16; 5-Yr. Net Flow (millions): $38,490.11; 10-Yr. Net Flow (millions): $65,009.04; 15-Yr. Net Flow (millions): $84,178.80; Inception Date: Nov. 12, 2001
FP042621_15 copy.png
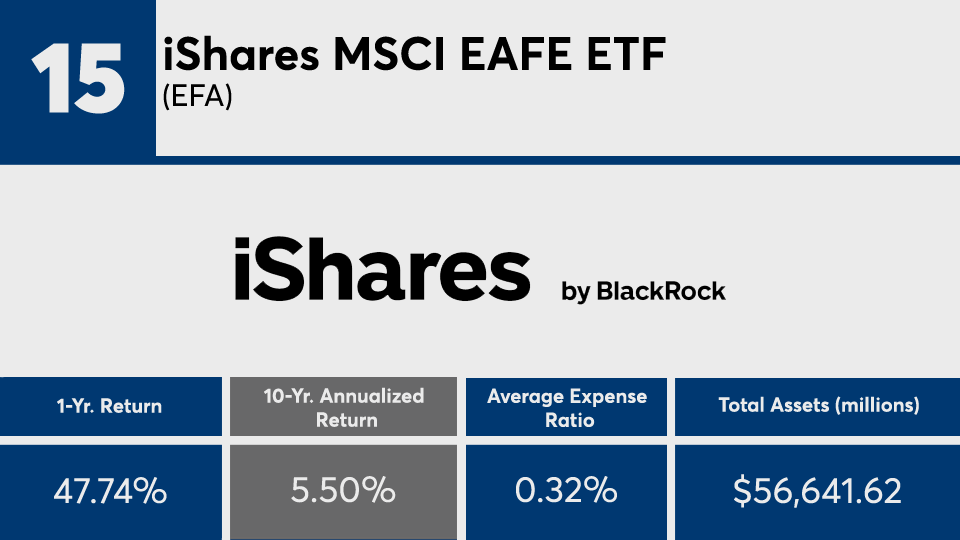
YTD Return: 7.45%; 3-Yr. Annualized Return: 6.49%; 5-Yr. Annualized Return: 8.91%; 15-Yr. Annualized Return: 4%; YTD Net Flow: (millions): $0; 1-Yr. Net Flow (millions): ($10,200.83); 3-Yr. Net Flow (millions): ($24,284.59); 5-Yr. Net Flow (millions): ($18,654.37); 10-Yr. Net Flow (millions): $3,814.12; 15-Yr. Net Flow (millions): $18,154.22; Inception Date: Aug. 14, 2001
FP042621_14 copy.png
YTD Return: 7.43%; 3-Yr. Annualized Return: 7.09%; 5-Yr. Annualized Return: 9.53%; 15-Yr. Annualized Return: N/A; YTD Net Flow: (millions): $2,761.76; 1-Yr. Net Flow (millions): $3,231.71; 3-Yr. Net Flow (millions): $13,892.09; 5-Yr. Net Flow (millions): $43,296.12; 10-Yr. Net Flow (millions): $69,661.26; 15-Yr. Net Flow (millions): N/A; Inception Date: July 20, 2007
FP042621_13 copy.png
YTD Return: 13.29%; 3-Yr. Annualized Return: 14.03%; 5-Yr. Annualized Return: 15.76%; 15-Yr. Annualized Return: 8.81%; YTD Net Flow: (millions): $2,917.97; 1-Yr. Net Flow (millions): $6,838.64; 3-Yr. Net Flow (millions): $8,201.71; 5-Yr. Net Flow (millions): $14,654.77; 10-Yr. Net Flow (millions): $17,679.07; 15-Yr. Net Flow (millions): $24,652.97; Inception Date: May 22, 2000
FP042621_12 copy.png
YTD Return: 13.44%; 3-Yr. Annualized Return: 11.64%; 5-Yr. Annualized Return: 12.68%; 15-Yr. Annualized Return: 8.26%; YTD Net Flow: (millions): $4,658.05; 1-Yr. Net Flow (millions): $8,581.61; 3-Yr. Net Flow (millions): $23,128.17; 5-Yr. Net Flow (millions): $33,013.70; 10-Yr. Net Flow (millions): $43,897.45; 15-Yr. Net Flow (millions): $47,444.03; Inception Date: Jan. 26, 2004
FP042621_11 copy.png
YTD Return: 17.46% 3-Yr. Annualized Return: 14.2% 5-Yr. Annualized Return: 14.59% 15-Yr. Annualized Return: 9.93% YTD Net Flow: (millions): $313.07 1-Yr. Net Flow (millions): ($2,034.40) 3-Yr. Net Flow (millions): $859.24 5-Yr. Net Flow (millions): $9,780.39 10-Yr. Net Flow (millions): $19,172.47 15-Yr. Net Flow (millions): $23,861.42 Inception Date: May 22, 2000
FP042621_10 copy.png
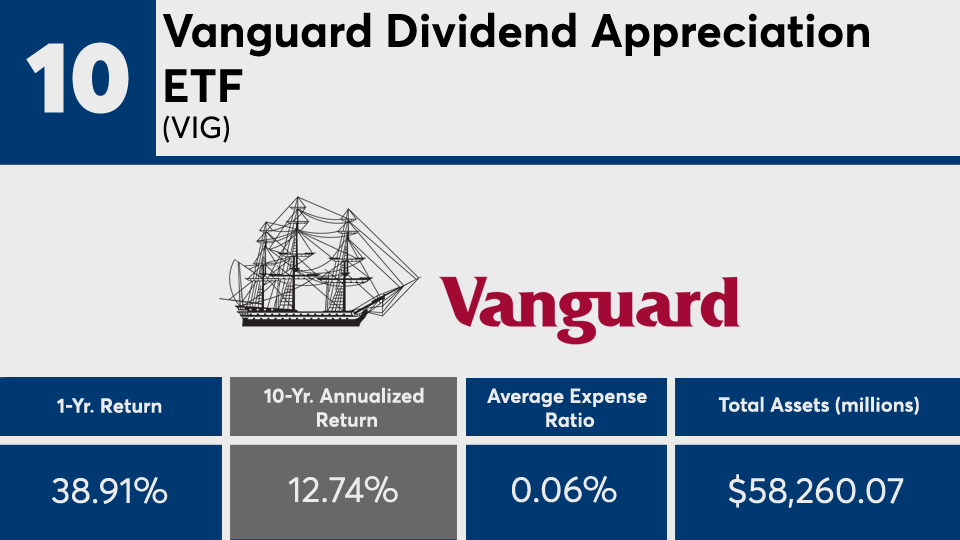
YTD Return: 7.98%; 3-Yr. Annualized Return: 16.61%; 5-Yr. Annualized Return: 15.48%; 15-Yr. Annualized Return: 9.92%; YTD Net Flow: (millions): $114.72; 1-Yr. Net Flow (millions): $3,279.29; 3-Yr. Net Flow (millions): $12,777.17; 5-Yr. Net Flow (millions): $14,104.25; 10-Yr. Net Flow (millions): $22,838.42; 15-Yr. Net Flow (millions): $27,866.31; Inception Date: April 21, 2006
FP042621_9 copy.png
YTD Return: 18.83% 3-Yr. Annualized Return: 12.93% 5-Yr. Annualized Return: 15.18% 15-Yr. Annualized Return: 9.68% YTD Net Flow: (millions): $2,030.92 1-Yr. Net Flow (millions): $5,694.73 3-Yr. Net Flow (millions): $13,639.86 5-Yr. Net Flow (millions): $24,828.77 10-Yr. Net Flow (millions): $30,199.49 15-Yr. Net Flow (millions): $31,504.77 Inception Date: May 22, 2000
FP042621_8 copy.png
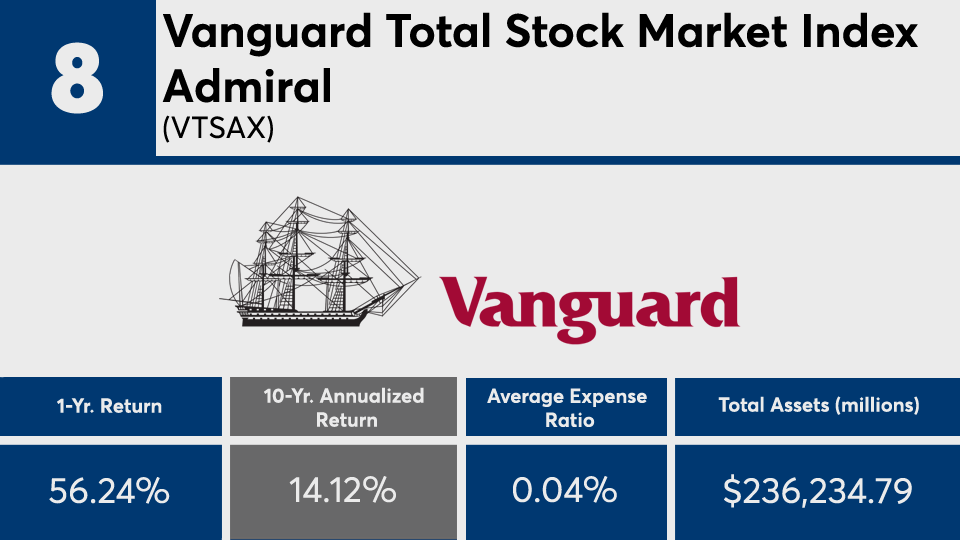
YTD Return: 10.6%; 3-Yr. Annualized Return: 18.12%; 5-Yr. Annualized Return: 17.12%; 15-Yr. Annualized Return: 10.34%; YTD Net Flow: (millions): ($47.24); 1-Yr. Net Flow (millions): ($23,983.04); 3-Yr. Net Flow (millions): ($13,071.30); 5-Yr. Net Flow (millions): ($484.1); 10-Yr. Net Flow (millions): $31,521.39; 15-Yr. Net Flow (millions): $52,989.04; Inception Date: Nov. 13, 2000
FP042621_7 copy.png
YTD Return: 10.55% 3-Yr. Annualized Return: 17.77% 5-Yr. Annualized Return: 16.73% 15-Yr. Annualized Return: 10.12% YTD Net Flow: (millions): ($2,514.05) 1-Yr. Net Flow (millions): ($9,419.79) 3-Yr. Net Flow (millions): ($21,866.24) 5-Yr. Net Flow (millions): ($4,951.23) 10-Yr. Net Flow (millions): $28,941.76 15-Yr. Net Flow (millions): $72,809.59 Inception Date: Jan. 22, 1993
FP042621_6 copy.png
YTD Return: 10.57%; 3-Yr. Annualized Return: 17.87%; 5-Yr. Annualized Return: 16.81%; 15-Yr. Annualized Return: 10.18%; YTD Net Flow: (millions): $503.73; 1-Yr. Net Flow (millions): $155.79; 3-Yr. Net Flow (millions): $3,378.63; 5-Yr. Net Flow (millions): $6,245.66; 10-Yr. Net Flow (millions): $8,129.52; 15-Yr. Net Flow (millions): $7,218.47; Inception Date: May 19, 1997
FP042621_5 copy.png
YTD Return: 10.57%; 3-Yr. Annualized Return: 17.86%; 5-Yr. Annualized Return: 16.82%; 15-Yr. Annualized Return: 10.17%; YTD Net Flow: (millions): $8,793.09; 1-Yr. Net Flow (millions): $11,176.78; 3-Yr. Net Flow (millions): $41,658.35; 5-Yr. Net Flow (millions): $85,909.54; 10-Yr. Net Flow (millions): $110,522.27; 15-Yr. Net Flow (millions): $117,196.39; Inception Date: May 15, 2000
FP042621_4 copy.png
YTD Return: 10.59% 3-Yr. Annualized Return: 17.87% 5-Yr. Annualized Return: 16.83% 15-Yr. Annualized Return: 10.2% YTD Net Flow: (millions): ($2,572.10) 1-Yr. Net Flow (millions): ($16,080.83) 3-Yr. Net Flow (millions): $567.59 5-Yr. Net Flow (millions): $24,085.11 10-Yr. Net Flow (millions): $60,405.37 15-Yr. Net Flow (millions): $66,571.67 Inception Date: Nov. 13, 2000
FP042621_3 copy.png
YTD Return: 7.51%; 3-Yr. Annualized Return: 25.13%; 5-Yr. Annualized Return: 21.76%; 15-Yr. Annualized Return: 12.51%; YTD Net Flow: (millions): ($212.73); 1-Yr. Net Flow (millions): $778.81; 3-Yr. Net Flow (millions): $6,238.02; 5-Yr. Net Flow (millions): $10,944.81; 10-Yr. Net Flow (millions): $20,168.04; 15-Yr. Net Flow (millions): $24,472.17; Inception Date: Jan. 26, 2004
FP042621_2 copy.png
YTD Return: 6.95%; 3-Yr. Annualized Return: 24.46%; 5-Yr. Annualized Return: 22.04%; 15-Yr. Annualized Return: 12.58%; YTD Net Flow: (millions): ($1,693.71); 1-Yr. Net Flow (millions): ($4,958.06); 3-Yr. Net Flow (millions): ($6,771.14); 5-Yr. Net Flow (millions): ($7,425.79); 10-Yr. Net Flow (millions): ($1,458.68); 15-Yr. Net Flow (millions): 5,546.48; Inception Date: May 22, 2000
FP042621_1 copy.png
YTD Return: 6.94%; 3-Yr. Annualized Return: 28.33%; 5-Yr. Annualized Return: 26.26%; 15-Yr. Annualized Return: 15.81%; YTD Net Flow: (millions): $856.98; 1-Yr. Net Flow (millions): $12,913.60; 3-Yr. Net Flow (millions): $25,669.70; 5-Yr. Net Flow (millions): $28,447.93; 10-Yr. Net Flow (millions): $20,548.12; 15-Yr. Net Flow (millions): $20,220.65; Inception Date: March 10, 1999
MORE FROM FINANCIAL PLANNING